

🍓0 博主介绍
- 👨🎓 博主介绍:大家好,我是可可卷,很高兴和大家见面~
- ✨主攻领域:【数据分析】【机器学习】 【深度学习】 【数据可视化】
- 🎉欢迎关注💗点赞👍收藏⭐️评论📝
- 🙏作者水平很有限,欢迎各位大佬指点,一起学习进步!


📚 文章目录
🍓1 情景引入
在普通分类问题上,我们一般通过 sklearn.metrics库评估模型,比如使用混淆矩阵
from sklearn.metrics import confusion_matrix

y_true = [2, 0, 2, 2, 0, 1]
y_pred = [0, 1, 2, 2, 0, 2]
cm=confusion_matrix(y_true, y_pred)
print(cm)
结果如下:
[[1 1 0]
 [0 0 1]
 [1 0 2]]
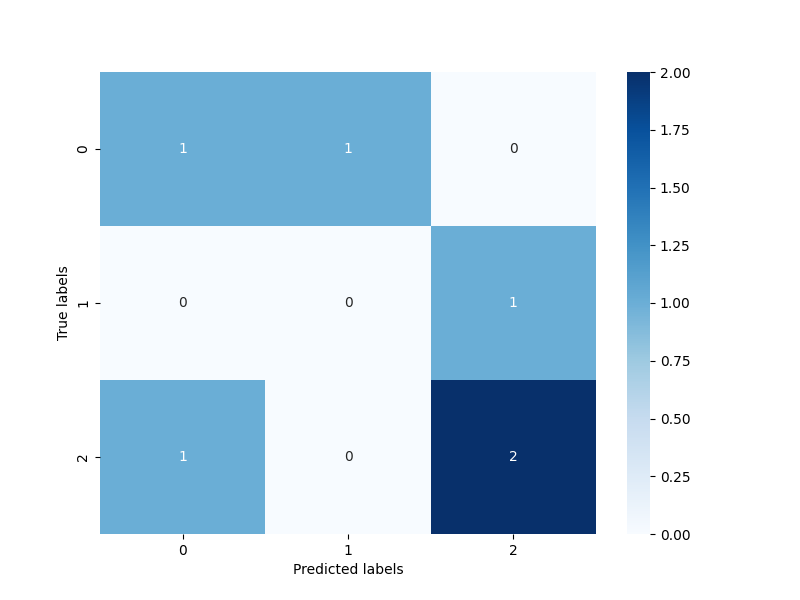
还可以结合热力图进行可视化
from matplotlib import pyplot as plt

plt.figure(figsize=(8, 6))
sns.heatmap(cm, annot=True, cmap='Blues')
plt.xlabel('Predicted labels')
plt.ylabel('True labels')
plt.show()
结果如下:
在需要依据多个指标评价模型时, classification_report也是个不错的选择
from sklearn.metrics import classification_report

y_true = [2, 0, 2, 2, 0, 1]
y_pred = [0, 1, 2, 2, 0, 2]
report=classification_report(y_true,y_pred)
print(report)
结果如下:
              precision    recall  f1-score   support

           0       0.50      0.50      0.50         2
           1       0.00      0.00      0.00         1
           2       0.67      0.67      0.67         3

    accuracy                           0.50         6
   macro avg       0.39      0.39      0.39         6
weighted avg       0.50      0.50      0.50         6
不过,当我们需要更多指标进行模型评估时,该怎么办呢?
我们通常会从 sklearn.metrics导入我们需要的指标,再分别调用,进行分析
from sklearn.metrics import cohen_kappa_score,hamming_loss,jaccard_score,accuracy_score

acc=accuracy_score(test_labels, pred_labels)    # 1.0
kappa = cohen_kappa_score(test_labels, pred_labels)    # 1.0
ham_distance = hamming_loss(test_labels, pred_labels)   # 0.0
jaccrd_score = jaccard_score(test_labels, pred_labels,average='micro') # 1.0
print(f'acc is {acc}')
print(f'kappa is {kappa}')
print(f'ham_distance is {ham_distance}')
print(f'jaccrd_score is {jaccrd_score}')
这不禁让我思考,是否存在更方便的方法呢?🎈
🎈🎈🎈我是分割线🎈🎈🎈
🍓2 pycm介绍
PyCM is a multi-class confusion matrix library written in Python that supports both input data vectors and direct matrix, and a proper tool for post-classification model evaluation that supports most classes and overall statistics parameters. PyCM is the swiss-army knife of confusion matrices, targeted mainly at data scientists that need a broad array of metrics for predictive models and accurate evaluation of a large variety of classifiers.
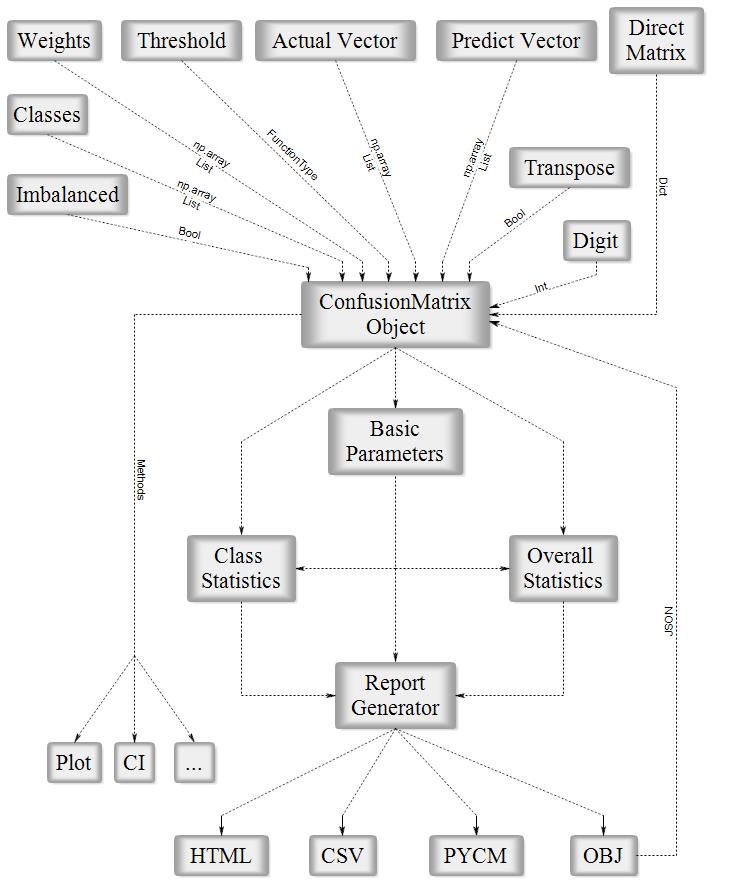
总结一下,就是说pycm是一个python库,适用于多分类模型的评估。
🎈🎈🎈我是分割线🎈🎈🎈
🍓3 pycm安装
⚠️ PyCM 2.4 is the last version to support Python 2.7 & Python 3.4
⚠️ Plotting capability requires Matplotlib (>= 3.0.0) or Seaborn (>= 0.9.1)
Source code
- Download Version 3.3 or Latest Source
- Run
pip install -r requirements.txtorpip3 install -r requirements.txt(Need root access) - Run
python3 setup.py installorpython setup.py install(Need root access)
PyPI
- Check Python Packaging User Guide
- Run
pip install pycm==3.3orpip3 install pycm==3.3(Need root access)
Conda
- Check Conda Managing Package
- Update Conda using
conda update conda(Need root access) - Run
conda install -c sepandhaghighi pycm(Need root access)
Easy install
- Run
easy_install --upgrade pycm(Need root access)
总结一下,pycm2.4需要python版本在2.4以上,且画图部分对 Matplotlib和 Seaborn的版本也有要求。推荐大家使用pip或conda安装,比较常用,遇到问题也容易解决。
🎈🎈🎈我是分割线🎈🎈🎈
🍓4 pycm使用
🍎4.1 输入向量
直接输入真实的类向量和预测的类向量
from pycm import *

y_true = [0,1,2,0,1,2,0,1,2]
y_pred = [2,1,2,1,0,1,2,1,0]
cm = ConfusionMatrix(actual_vector=y_true, predict_vector=y_pred)

print(cm)
输出结果分为3部分:
🍊4.1.1 混淆矩阵
Predict 0       1       2
Actual
0       0       1       2

1       1       2       0

2       1       1       1
🍊4.1.2 总体指标
Overall Statistics :

95% CI                                                            (0.02535,0.64132)
ACC Macro                                                         0.55556
ARI                                                               -0.07143
AUNP                                                              0.5
AUNU                                                              0.5
Bennett S                                                         0.0
CBA                                                               0.27778
CSI                                                               -0.38889
Chi-Squared                                                       3.5
Chi-Squared DF                                                    4
Conditional Entropy                                               1.14052
Cramer V                                                          0.44096
Cross Entropy                                                     1.6416
F1 Macro                                                          0.30159
F1 Micro                                                          0.33333
FNR Macro                                                         0.66667
FNR Micro                                                         0.66667
FPR Macro                                                         0.33333
FPR Micro                                                         0.33333
Gwet AC1                                                          0.00461
Hamming Loss                                                      0.66667
Joint Entropy                                                     2.72548
KL Divergence                                                     0.05664
Kappa                                                             0.0
Kappa 95% CI                                                      (-0.46198,0.46198)
Kappa No Prevalence                                               -0.33333
Kappa Standard Error                                              0.2357
Kappa Unbiased                                                    -0.00935
Lambda A                                                          0.33333
Lambda B                                                          0.2
Mutual Information                                                0.38998
NIR                                                               0.33333
Overall ACC                                                       0.33333
Overall CEN                                                       0.73254
Overall J                                                         (0.6,0.2)
Overall MCC                                                       0.0
Overall MCEN                                                      0.79544
Overall RACC                                                      0.33333
Overall RACCU                                                     0.33951
P-Value                                                           0.62282
PPV Macro                                                         0.27778
PPV Micro                                                         0.33333
Pearson C                                                         0.52915
Phi-Squared                                                       0.38889
RCI                                                               0.24605
RR                                                                3.0
Reference Entropy                                                 1.58496
Response Entropy                                                  1.53049
SOA1(Landis & Koch)                                               Slight
SOA2(Fleiss)                                                      Poor
SOA3(Altman)                                                      Poor
SOA4(Cicchetti)                                                   Poor
SOA5(Cramer)                                                      Relatively Strong
SOA6(Matthews)                                                    Negligible
Scott PI                                                          -0.00935
Standard Error                                                    0.15713
TNR Macro                                                         0.66667
TNR Micro                                                         0.66667
TPR Macro                                                         0.33333
TPR Micro                                                         0.33333
Zero-one Loss                                                     6
🍊4.1.3 各类指标
Class Statistics :

Classes                                                           0             1             2
ACC(Accuracy)                                                     0.44444       0.66667       0.55556
AGF(Adjusted F-score)                                             0.0           0.69338       0.4714
AGM(Adjusted geometric mean)                                      0             0.66667       0.54951
AM(Difference between automatic and manual classification)        -1            1             0
AUC(Area under the ROC curve)                                     0.33333       0.66667       0.5
AUCI(AUC value interpretation)                                    Poor          Fair          Poor
AUPR(Area under the PR curve)                                     0.0           0.58333       0.33333
BCD(Bray-Curtis dissimilarity)                                    0.05556       0.05556       0.0
BM(Informedness or bookmaker informedness)                        -0.33333      0.33333       0.0
CEN(Confusion entropy)                                            0.96096       0.60158       0.69499
DOR(Diagnostic odds ratio)                                        0.0           4.0           1.0
DP(Discriminant power)                                            None          0.33193       -0.0
DPI(Discriminant power interpretation)                            None          Poor          Poor
ERR(Error rate)                                                   0.55556       0.33333       0.44444
F0.5(F0.5 score)                                                  0.0           0.52632       0.33333
F1(F1 score - harmonic mean of precision and sensitivity)         0.0           0.57143       0.33333
F2(F2 score)                                                      0.0           0.625         0.33333
FDR(False discovery rate)                                         1.0           0.5           0.66667
FN(False negative/miss/type 2 error)                              3             1             2
FNR(Miss rate or false negative rate)                             1.0           0.33333       0.66667
FOR(False omission rate)                                          0.42857       0.2           0.33333
FP(False positive/type 1 error/false alarm)                       2             2             2
FPR(Fall-out or false positive rate)                              0.33333       0.33333       0.33333
G(G-measure geometric mean of precision and sensitivity)          0.0           0.57735       0.33333
GI(Gini index)                                                    -0.33333      0.33333       0.0
GM(G-mean geometric mean of specificity and sensitivity)          0.0           0.66667       0.4714
IBA(Index of balanced accuracy)                                   0.0           0.44444       0.14815
ICSI(Individual classification success index)                     -1.0          0.16667       -0.33333
IS(Information score)                                             None          0.58496       0.0
J(Jaccard index)                                                  0.0           0.4           0.2
LS(Lift score)                                                    0.0           1.5           1.0
MCC(Matthews correlation coefficient)                             -0.37796      0.31623       0.0
MCCI(Matthews correlation coefficient interpretation)             Negligible    Weak          Negligible
MCEN(Modified confusion entropy)                                  0.96096       0.69658       0.72877
MK(Markedness)                                                    -0.42857      0.3           0.0
N(Condition negative)                                             6             6             6
NLR(Negative likelihood ratio)                                    1.5           0.5           1.0
NLRI(Negative likelihood ratio interpretation)                    Negligible    Negligible    Negligible
NPV(Negative predictive value)                                    0.57143       0.8           0.66667
OC(Overlap coefficient)                                           0.0           0.66667       0.33333
OOC(Otsuka-Ochiai coefficient)                                    0.0           0.57735       0.33333
OP(Optimized precision)                                           -0.55556      0.66667       0.22222
P(Condition positive or support)                                  3             3             3
PLR(Positive likelihood ratio)                                    0.0           2.0           1.0
PLRI(Positive likelihood ratio interpretation)                    Negligible    Poor          Negligible
POP(Population)                                                   9             9             9
PPV(Precision or positive predictive value)                       0.0           0.5           0.33333
PRE(Prevalence)                                                   0.33333       0.33333       0.33333
Q(Yule Q - coefficient of colligation)                            -1.0          0.6           0.0
QI(Yule Q interpretation)                                         Negligible    Moderate      Negligible
RACC(Random accuracy)                                             0.07407       0.14815       0.11111
RACCU(Random accuracy unbiased)                                   0.07716       0.15123       0.11111
TN(True negative/correct rejection)                               4             4             4
TNR(Specificity or true negative rate)                            0.66667       0.66667       0.66667
TON(Test outcome negative)                                        7             5             6
TOP(Test outcome positive)                                        2             4             3
TP(True positive/hit)                                             0             2             1
TPR(Sensitivity, recall, hit rate, or true positive rate)         0.0           0.66667       0.33333
Y(Youden index)                                                   -0.33333      0.33333       0.0
dInd(Distance index)                                              1.05409       0.4714        0.74536
sInd(Similarity index)                                            0.25464       0.66667       0.47295
可以看到,大部分总体指标比如F1 score、Kappa等都被包含在内,各类指标如基尼指数、AUC也在内。
🍎4.2 输入矩阵
from pycm import *
cm = ConfusionMatrix(matrix={"Class1": {"Class1": 1, "Class2":2}, "Class2": {"Class1": 3, "Class2": 4}})

print(cm)
结果如下:
Predict      Class1       Class2
Actual
Class1       1            2

Class2       3            4
其余指标与4.1相同。
🎈🎈🎈我是分割线🎈🎈🎈
🍓5 进阶用法
🍎5.1 获取各类指标
- 通过cm.print_matrix()打印混淆矩阵
- 通过cm.print_normalized_matrix()打印归一化后的混淆矩阵
- 通过cm.plot()作热力图,可以通过修改cmap=plt.cm.Greens参数自定义颜色
- 通过cm.overall_stat,cm.class_stat分别获取总体指标与各类指标的字典
- 通过cm.overall_stat[‘Kappa’]的形式获取某一个具体指标
🍎5.2 比较器
这里给出一个 官方的用例:
>>> cm2 = ConfusionMatrix(matrix={0:{0:2,1:50,2:6},1:{0:5,1:50,2:3},2:{0:1,1:7,2:50}})
>>> cm3 = ConfusionMatrix(matrix={0:{0:50,1:2,2:6},1:{0:50,1:5,2:3},2:{0:1,1:55,2:2}})
>>> cp = Compare({"cm2":cm2,"cm3":cm3})
>>> print(cp)
Best : cm2

Rank  Name   Class-Score    Overall-Score
1     cm2    9.05           2.55
2     cm3    6.05           1.98333

>>> cp.best
pycm.ConfusionMatrix(classes: [0, 1, 2])
>>> cp.sorted
['cm2', 'cm3']
>>> cp.best_name
'cm2'
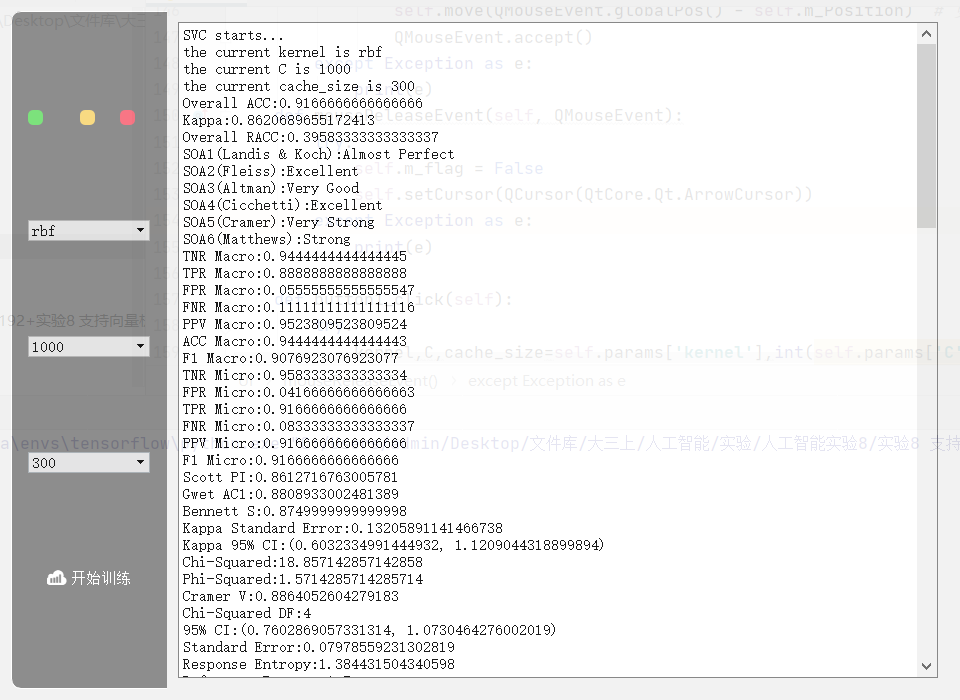
🍎 5.3 配合pyQt搭建GUI
🎈🎈🎈我是分割线🎈🎈🎈
🍓6 结语
以后再遇到分类问题,就不用为寻找评估指标发愁啦,一键使用pycm,直接给出大量指标,还可以通过比较器选出最优预测结果,高效!
Original: https://blog.csdn.net/weixin_45825073/article/details/122042165
Author: 可可卷
Title: 【机器学习】pycm–史上最强多分类性能评估库
原创文章受到原创版权保护。转载请注明出处:https://www.johngo689.com/667611/
转载文章受原作者版权保护。转载请注明原作者出处!