

文章目录
任务描述
构建一个模型,根据鸢尾花的花萼和花瓣大小将其分为三种不同的品种
数据集
总共包含150行数据
每一行数据由 4 个特征值及一个目标值组成。
4 个特征值分别为:萼片长度、萼片宽度、花瓣长度、花瓣宽度
目标值为三种不同类别的鸢尾花,分别为: Iris setosa、Iris versicolour、Iris virginica


首先导入必要的包:
numpy : python第三方库,用于科学计算
matplotlib : python第三方库,主要用于进行可视化
sklearn: python的重要机器学习库,其中封装了大量的机器学习算法,如:分类、回归、降维以及聚类
import numpy as np
from matplotlib import colors
from sklearn import svm
from sklearn.svm import SVC
from sklearn import model_selection
import matplotlib.pyplot as plt
import matplotlib as mpl
Step1. 数据准备
- 从指定路径下加载数据
- 对加载的数据进行数据分割,
x_train,y_train,x_test,y_test分别表示训练集特征、训练集标签、测试集特征、测试集标签
def iris_type(s):
    it = {b'Iris-setosa':0, b'Iris-versicolor':1, b'Iris-virginica':2}
    return it[s]
b' '表示这是一个 bytes 对象,用在Python3中,Python3里默认的str是unicode类。Python2的str本身就是bytes类。
data_path='/home/aistudio/data/data2301/iris.data'
data = np.loadtxt(data_path,
                  dtype=float,
                  delimiter=',',
                  converters={4:iris_type})

x, y = np.split(data,
                (4,),
                axis=1)
x = x[:, 0:2]

x_train, x_test, y_train, y_test = model_selection.train_test_split(x,
                                                                    y,
                                                                    random_state=1,
                                                                    test_size=0.3)
Step2. 模型搭建
C: float,可选(默认值= 1.0)
错误术语的惩罚参数C。C越大,相当于惩罚松弛变量,希望松弛变量接近0,即对误分类的惩罚增大,趋向于对训练集全分对的情况,这样对训练集测试时准确率很高,但泛化能力弱。C值小,对误分类的惩罚减小,允许容错,将他们当成噪声点,泛化能力较强。kernel: string,optional(default =’rbf’)
核函数类型,str类型,默认为’rbf’。可选参数为:’linear’:线性核函数‘poly’:多项式核函数‘rbf’:径像核函数/高斯核‘sigmod’:sigmod核函数-
‘precomputed’:核矩阵precomputed表示自己提前计算好核函数矩阵,这时候算法内部就不再用核函数去计算核矩阵,而是直接用你给的核矩阵,核矩阵需要为n*n的。 -
decision_function_shape: ‘ovo’,’ovr’,默认= ‘ovr’
决策函数类型,可选参数 ‘ovo’ 和 ‘ovr’ ,默认为 ‘ovr’ 。
decision_function_shape= ‘ovr’时,为one v rest,即一个类别与其他类别进行划分,
decision_function_shape= ‘ovo’时,为one v one,即将类别两两之间进行划分,用二分类的方法模拟多分 类的结果。
def classifier():

    clf = svm.SVC(C=0.5,
                  kernel='linear',
                  decision_function_shape='ovr')
    return clf
clf = classifier()
Step3.模型训练
def train(clf,x_train,y_train):
    clf.fit(x_train,
            y_train.ravel())
train(clf,x_train,y_train)
fit()方法用于训练svm,具体参数已经在定义svc对象时给出,这时候只需要给出数据集x和x对应的标签y。
ravel()方法将数组维度拉成一维数组
Step4. 模型评估
def show_accuracy(a, b, tip):
    acc = a.ravel() == b.ravel()
    print('%s Accuracy:%.3f' %(tip, np.mean(acc)))
def print_accuracy(clf,x_train,y_train,x_test,y_test):

    print('trianing prediction:%.3f' %(clf.score(x_train, y_train)))
    print('test data prediction:%.3f' %(clf.score(x_test, y_test)))

    show_accuracy(clf.predict(x_train), y_train, 'traing data')
    show_accuracy(clf.predict(x_test), y_test, 'testing data')

    print('decision_function:\n', clf.decision_function(x_train))
print_accuracy(clf, x_train, y_train, x_test, y_test)

scikit-learn工具包中分类模型predict_proba、predict、decision_function用法详解_ 原理介绍很赞
Step5. 模型使用
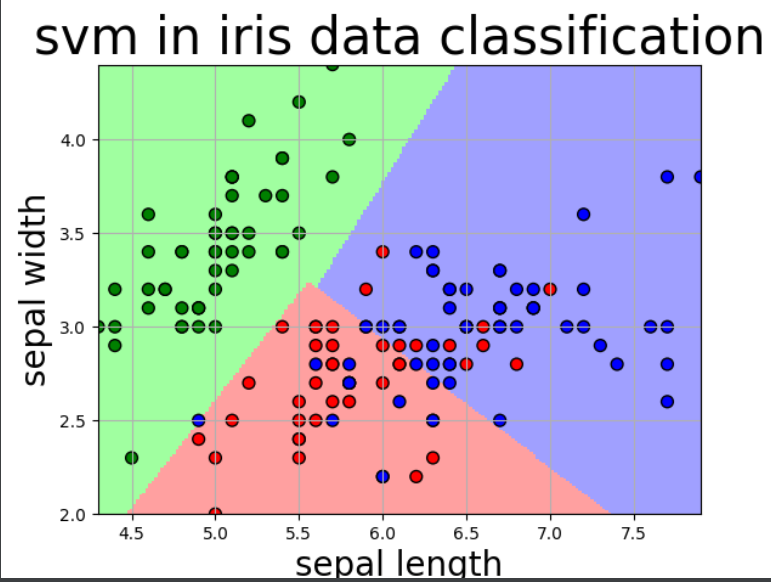
def draw(clf, x):
    iris_feature = 'sepal length', 'sepal width', 'petal lenght', 'petal width'

    x1_min, x1_max = x[:, 0].min(), x[:, 0].max()
    x2_min, x2_max = x[:, 1].min(), x[:, 1].max()
    x1, x2 = np.mgrid[x1_min:x1_max:200j, x2_min:x2_max:200j]
    grid_test = np.stack((x1.flat, x2.flat), axis=1)
    print('grid_test:\n', grid_test)

    z = clf.decision_function(grid_test)
    print('the distance to decision plane:\n', z)

    grid_hat = clf.predict(grid_test)
    print('grid_hat:\n', grid_hat)
    grid_hat = grid_hat.reshape(x1.shape)

    cm_light = mpl.colors.ListedColormap(['#A0FFA0', '#FFA0A0', '#A0A0FF'])
    cm_dark = mpl.colors.ListedColormap(['g', 'r', 'b'])

    plt.pcolormesh(x1, x2, grid_hat, cmap=cm_light)
    plt.scatter(x[:, 0], x[:, 1], c=np.squeeze(y), edgecolor='k', s=50, cmap=cm_dark)
    plt.scatter(x_test[:, 0], x_test[:, 1], s=120, facecolor='none', zorder=10)
    plt.xlabel(iris_feature[0], fontsize=20)
    plt.ylabel(iris_feature[1], fontsize=20)
    plt.xlim(x1_min, x1_max)
    plt.ylim(x2_min, x2_max)
    plt.title('svm in iris data classification', fontsize=30)
    plt.grid()
    plt.show()
draw(clf,x)
grid_test:
 [[4.3       2.       ]
 [4.3       2.0120603]
 [4.3       2.0241206]
 ...

 [7.9       4.3758794]
 [7.9       4.3879397]
 [7.9       4.4      ]]
the distance to decision plane:
 [[ 2.17689921  1.23467171 -0.25941323]
 [ 2.17943684  1.23363096 -0.25941107]
 [ 2.18189345  1.23256802 -0.25940892]
 ...

 [-0.27958977  0.83621535  2.28683228]
 [-0.27928358  0.8332275   2.28683314]
 [-0.27897389  0.83034313  2.28683399]]
grid_hat:
 [0. 0. 0. ... 2. 2. 2.]
若训练的不是0,1列,而是2,3列,则模型准确率会提高


若训练所有列,准确率达到最高

3D可视化模型
现在挑选0,2,3列进行3维的建模
x = np.stack((x[:, 0], x[:, 2], x[:, 3]), axis=1)
def draw(clf, x):
    iris_feature = 'sepal length', 'sepal width', 'petal lenght', 'petal width'

    x0_min, x0_max = x[:, 0].min(), x[:, 0].max()
    x1_min, x1_max = x[:, 1].min(), x[:, 1].max()
    x2_min, x2_max = x[:, 2].min(), x[:, 2].max()
    x0, x1, x2 = np.mgrid[x0_min:x0_max:50j, x1_min:x1_max:50j, x2_min:x2_max:50j]
    grid_test = np.stack((x0.flat, x1.flat, x2.flat), axis=1)
    print('grid_test:\n', grid_test)

    grid_hat = clf.predict(grid_test)
    print('grid_hat:\n', grid_hat)
    grid_hat = grid_hat.reshape(x1.shape)

    cm_light = mpl.colors.ListedColormap(['#A0FFA0', '#FFA0A0', '#A0A0FF'])
    cm_dark = mpl.colors.ListedColormap(['g', 'r', 'b'])

    fig = plt.figure()
    ax = fig.add_subplot(projection='3d')

    ax.scatter(xs=x1, ys=x2, zs=x0, zdir='z', s=10, c=grid_hat, depthshade=True, cmap=cm_light,alpha=0.01)
    ax.scatter(xs=x[:,1], ys=x[:,2], zs=x[:,0], zdir='z', s=30, c=np.squeeze(y), depthshade=True, cmap=cm_dark, marker="^")
    plt.show()

draw(clf, x)
结果如下

Original: https://blog.csdn.net/weixin_49355185/article/details/126351038
Author: 赵鸣漩
Title: 深度学习经典应用——鸢尾花分类(基于sklearn包)+三维成果可视化
原创文章受到原创版权保护。转载请注明出处:https://www.johngo689.com/667523/
转载文章受原作者版权保护。转载请注明原作者出处!