

颜色图或调色板是指一系列的有规律的颜色的集合,可以区分不同类型的离散数据或不同值的连续数据。一般在matplotlib中称为colormap(在绘图函数中的关键字为cmap),在seaborn中一般称为color palette(在绘图函数中的关键字为palette)。由于seaborn是基于matplotlib开发的,因此matplotlib中的各类colormap一般seaborn均支持。
为统一起见,下文统称为palette或调色板。
调色板一般分为三类:
- 离散型(qualitative):用来表示没有顺序关系的不同数据
- 连续型(sequential):用来表示有序关系的连续数据
- 连续双边型(diverging):类似连续型,但数据的分布会跨越一个中间点(一般为0),在表示数据的特征时用来强调值在两端的数据,弱化值在中间的数据
下文分别列出各类常用的调色板若干。
import seaborn as sns
离散型
seaborn库自带的调色板
sns.color_palette()


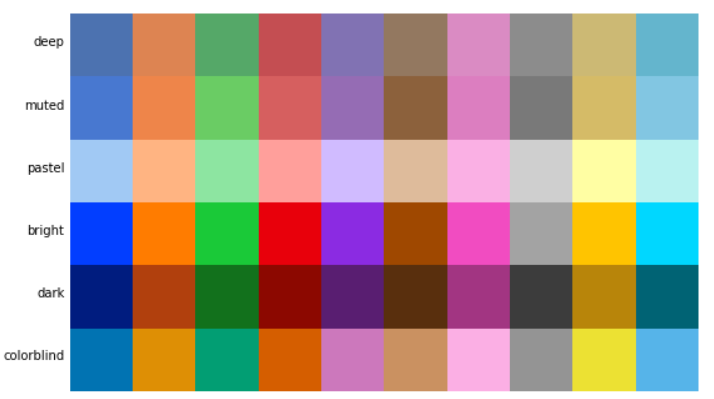
seaborn除了默认的调色板外,自带了”deep”, “muted”, “pastel”, “bright”, “dark”, “colorblind”等6种调色板
sns.color_palette("deep")

pallettes = ["deep", "muted", "pastel", "bright", "dark", "colorblind"]
data = np.array([sns.color_palette(pat) for pat in pallettes])
fig = plt.figure(figsize=(9,16))
ax = fig.add_subplot(111)
ax.imshow(data)
for i, pat in enumerate(pallettes):
    ax.text(-0.6, i, pat, ha="right")
plt.axis("off");
import numpy as np
import pandas as pd
import matplotlib.pyplot as plt
col1 = ["A"]*5 + ["B"]*5
col2 = list("abcde")*2
val = np.random.rand(10)
df = pd.DataFrame({"col1":col1, "col2":col2, "val":val})
df
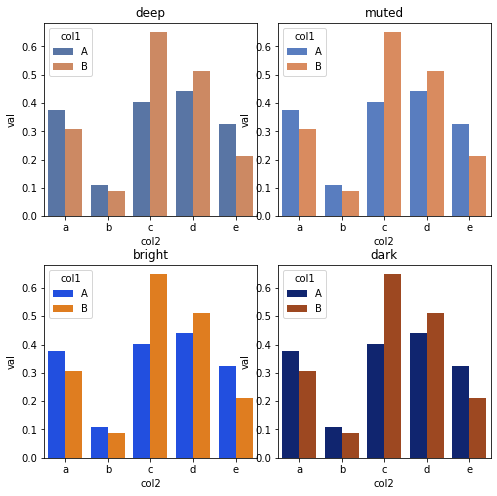
fig = plt.figure(figsize=(8,8))
fig.subplots_adjust(wspace=0.1, hspace=0.25)
for i, palette in enumerate(["deep", "muted", "bright", "dark"]):
ax = fig.add_subplot(2, 2, i+1)
sns.barplot(x="col2", y="val", hue="col1", data=df, ax=ax, palette=palette)
ax.set_title(palette)
自定义调色板
可利用hls(色相、亮度、饱和度)颜色空间自定义任意数量颜色的调色板
sns.color_palette("hls", 8)

sns.color_palette("hls", 16)

sns.color_palette("husl", 8)

其它调色板
主要是matplotlib库自带的调色板,有’Pastel1′, ‘Pastel2’, ‘Paired’, ‘Accent’,’Dark2′, ‘Set1’, ‘Set2’, ‘Set3’, ‘tab10’, ‘tab20’, ‘tab20b’, ‘tab20c’等
sns.color_palette("Set2")

sns.color_palette("tab10")

连续型
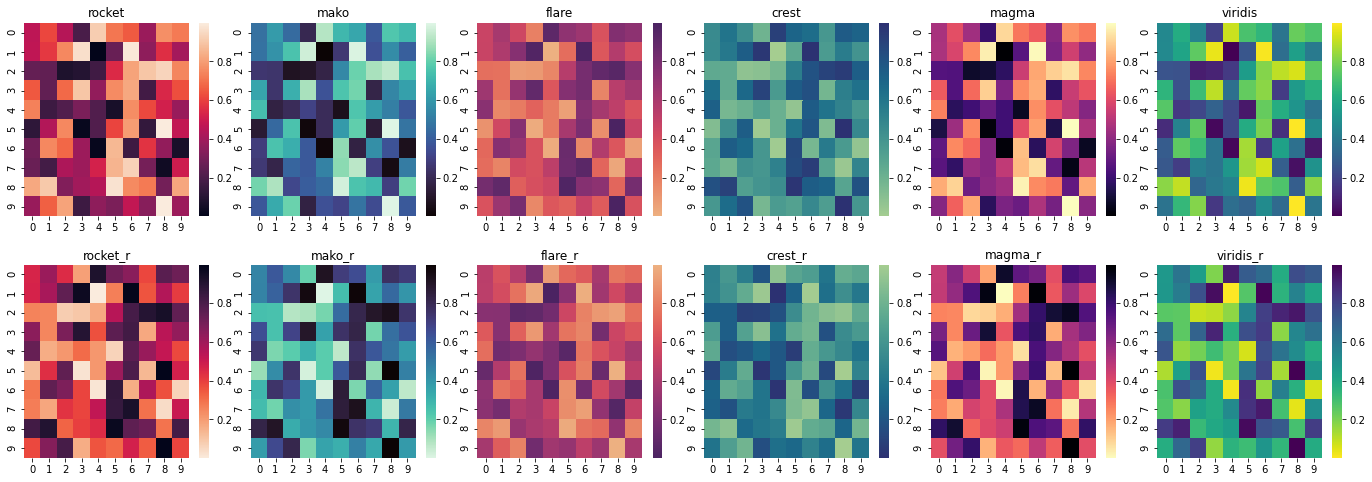
主要有”rocket”, “mako”, “flare”和”crest”,其中”rocket”, “mako”适合较大的数值跨度;名称后面加”_r”表示翻转。
同时也支持matploblib自带的”magma”、”viridis”等。
也可用sns.cubehelix_palette函数自定义。
fig = plt.figure(figsize=(24,8))
fig.subplots_adjust(wspace=0.1, hspace=0.25)
palettes = ["rocket", "mako", "flare", "crest", "magma", "viridis"]
palettes += [pat+"_r" for pat in palettes]
data = np.random.rand(10,10)
for i, palette in enumerate(palettes):
    ax = fig.add_subplot(2, 6, i+1)
    sns.heatmap(data, cmap=palette)
    ax.set_title(palette)
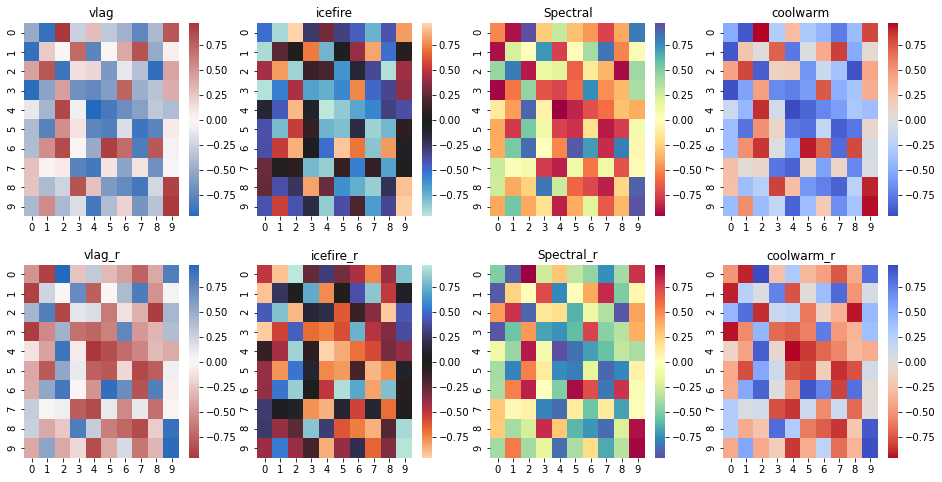
连续双边型
主要有”vlag”和”icefire”;以及matplotlib自带的”Spectral”和”coolwarm”;名称后面加”_r”表示翻转。也可用sns.diverging_palette函数自定义
fig = plt.figure(figsize=(16,8))
fig.subplots_adjust(wspace=0.2, hspace=0.25)
palettes = ["vlag", "icefire", "Spectral", "coolwarm"]
palettes += [pat+"_r" for pat in palettes]
data = np.random.rand(10,10)*2-1
for i, palette in enumerate(palettes):
    ax = fig.add_subplot(2, 4, i+1)
    sns.heatmap(data, cmap=palette)
    ax.set_title(palette)
参考
Choosing Colormaps in Matplotlib
Original: https://blog.csdn.net/qiu_xingye/article/details/121914314
Author: qiu_xingye
Title: matplotlib和seaborn中的颜色图(colormap)和调色板(color palette)
原创文章受到原创版权保护。转载请注明出处:https://www.johngo689.com/764564/
转载文章受原作者版权保护。转载请注明原作者出处!