

file_data.shape
空值处理
file_data = file_data.dropna
file_data.shape
删除空值,最好先做判断
空值处理
file_data = file_data.dropna
单个值实现
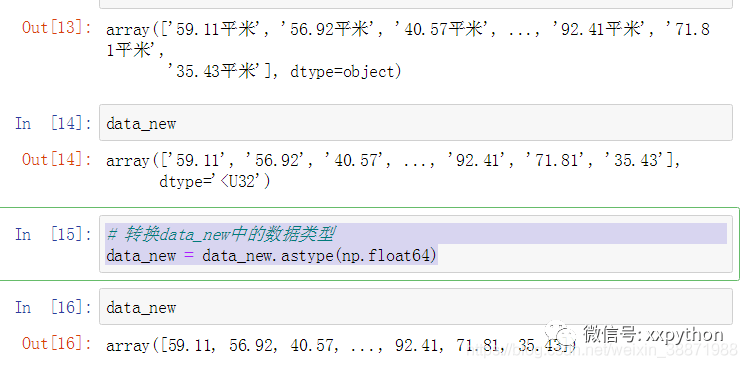
file_data[“面积(㎡)”].values[0][:-2]
创建一个空的数组
data_new = np.array([])
data_area = file_data[“面积(㎡)”].values
for i in data_area:
data_new = np.append(data_new, np.array(i[:-2]))
转换data_new中的数据类型
data_new = data_new.astype(np.float64)
file_data.loc[:, “面积(㎡)”] = data_new
house_data = file_data[“户型”]
temp_list = []
for i in house_data:
print(i)
new_info = i.replace(“房间”, “室”)
temp_list.append(new_info)
file_data.loc[:, “户型”] = temp_list

房源数量、位置分布分析
file_data[“区域”].unique
new_df = pd.DataFrame({“区域”:file_data[“区域”].unique, “数量”:[0]*13})
获取每个区域房源数量
area_count = file_data.groupby(by=”区域”).count
new_df[“数量”] = area_count.values
new_df.sort_values(by=”数量”, ascending=False)
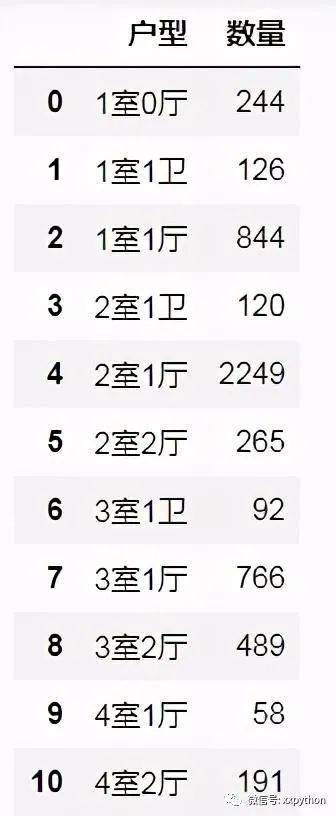
户型数量分析
def all_house(arr):
key = np.unique(arr)
result = {}
for k in key:
mask = (arr == k)
arr_new = arr[mask]
v = arr_new.size
result[k] = v
return result
house_info = all_house(house_data)
去掉统计数量较少的值
去掉统计数量较少的值
house_data = dict((key, value) for key, value in house_info.items if value > 50)
show_houses = pd.DataFrame({“户型”: [x for x in house_data.keys],
“数量”: [x for x in house_data.values]})
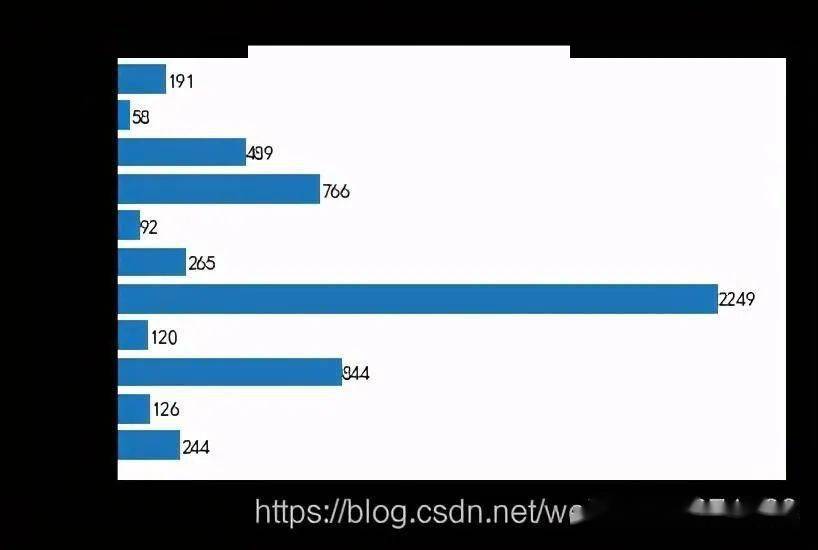
图形展示
图形展示房屋类型
house_type = show_houses[“户型”]
house_type_num = show_houses[“数量”]
plt.barh(range(11), house_type_num)
plt.yticks(range(11), house_type)
plt.xlim(0, 2500)
plt.title(“北京市各区域租房数量统计”)
plt.xlabel(“数量”)
plt.ylabel(“房屋类型”)
给每个条上面添加具体数字
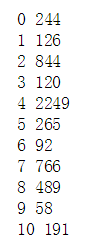
for x, y in enumerate(house_type_num):
print(x, y)
plt.text(y+0.5, x-0.2, “%s” %y)
plt.show
for x, y in enumerate(house_type_num):
print(x, y)
拿到定点坐标位置,在坐标位置附上Y值
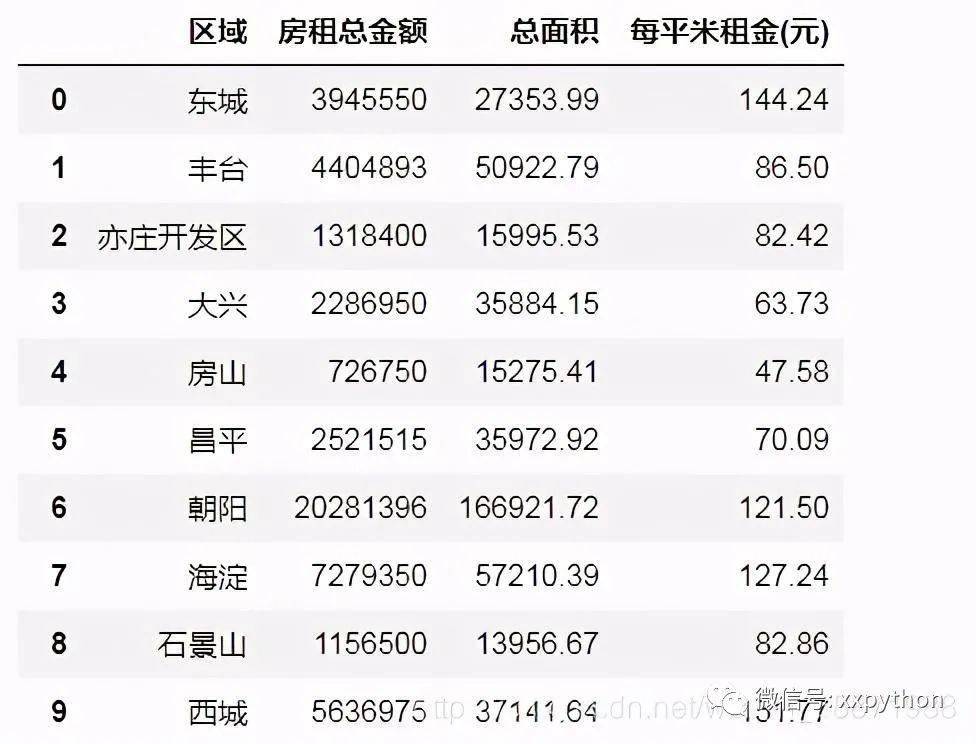
平均租金分析
df_all = pd.DataFrame({“区域”: file_data[“区域”].unique,
“房租总金额”: [0]*13,
“总面积”: [0]*13})
sum_price = file_data[“价格(元/月)”].groupby(file_data[“区域”]).sum
sum_area = file_data[“面积(㎡)”].groupby(file_data[“区域”]).sum
df_all[“房租总金额”] = sum_price.values
df_all[“总面积”] = sum_area.values
计算各个区域每平方米的房租
计算各个区域每平方米的房租
df_all[“每平米租金(元)”] = round(df_all[“房租总金额”] / df_all[“总面积”], 2)
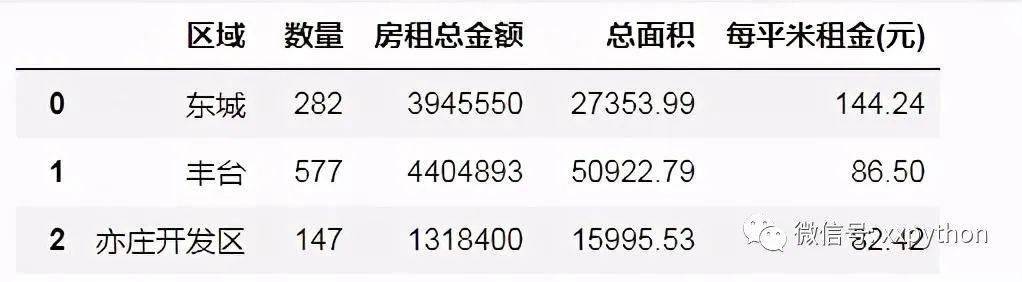
合并
df_merge = pd.merge(new_df, df_all)
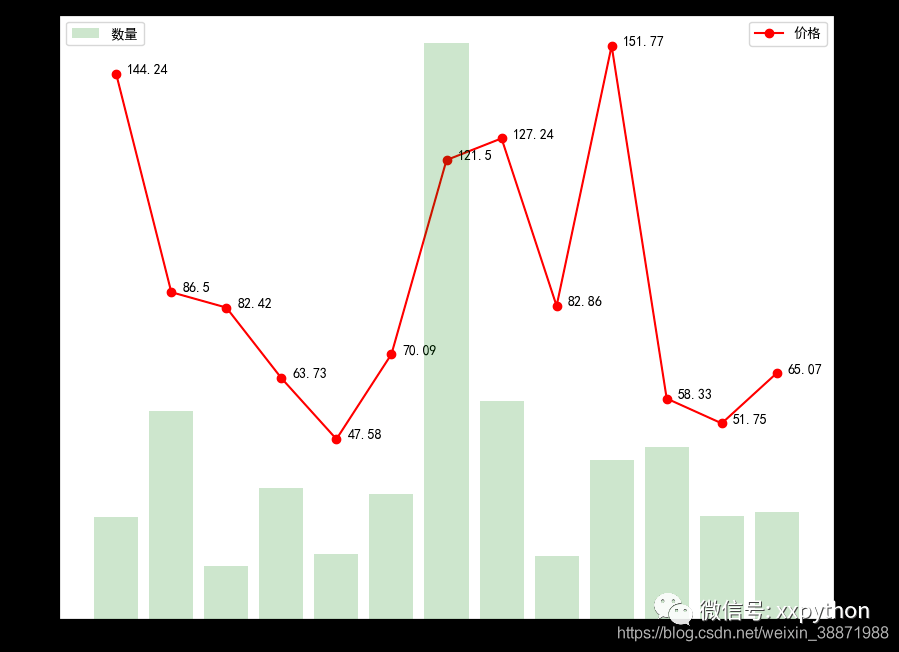
图形可视化
图形可视化
num = df_merge[“数量”]
price = df_merge[“每平米租金(元)”]
lx = df_merge[“区域”]
l = [i for i in range(13)]
fig = plt.figure(figsize=(10, 8), dpi=100)
显示折线图
ax1 = fig.add_subplot(111)
ax1.plot(l, price, “or-“, label=”价格”)
for i, (_x, _y) in enumerate(zip(l, price)):
plt.text(_x+0.2, _y, price[i])
ax1.set_ylim([0, 160])
ax1.set_ylabel(“价格”)
plt.legend(loc=”upper right”)
显示条形图
ax2 = ax1.twinx
plt.bar(l, num, label=”数量”, alpha=0.2, color=”green”)
ax2.set_ylabel(“数量”)
plt.legend(loc=”upper left”)
plt.xticks(l, lx)
plt.show
创建x,y轴共享
增加刻度,字符串一一对应
面积基本分析
查看房屋的最大面积和最小面积
print(‘房屋最大面积是%d平米’%(file_data[‘面积(㎡)’].max))
print(‘房屋最小面积是%d平米’%(file_data[‘面积(㎡)’].min))
查看房租的最高值和最小值
print(‘房租最高价格为每月%d元’%(file_data[‘价格(元/月)’].max))
print(‘房屋最低价格为每月%d元’%(file_data[‘价格(元/月)’].min))
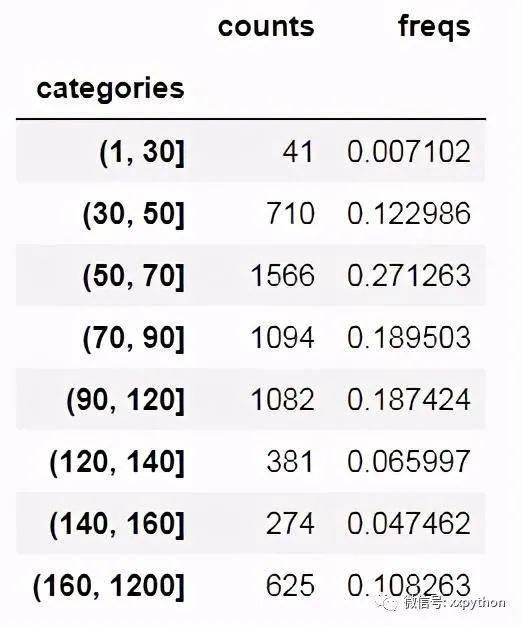
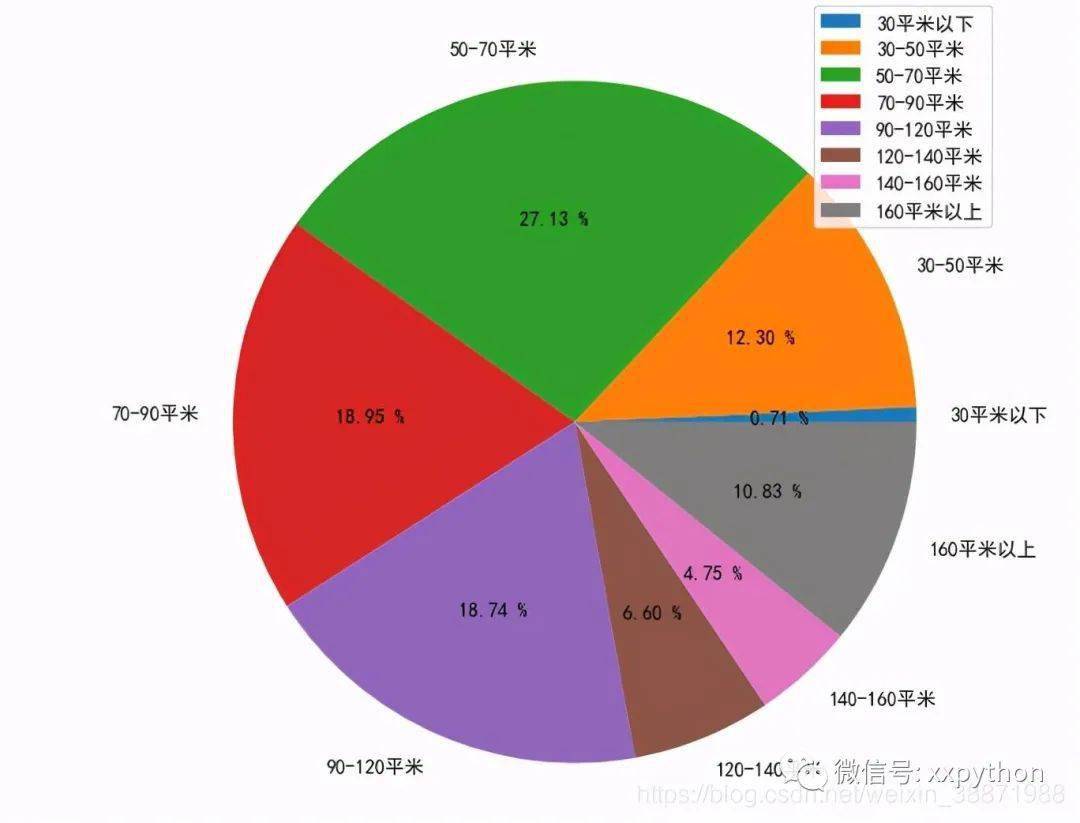
面积划分
面积划分
area_divide = [1, 30, 50, 70, 90, 120, 140, 160, 1200]
area_cut = pd.cut(list(file_data[“面积(㎡)”]), area_divide)
area_cut_num = area_cut.describe
饼图展示
图像可视化
area_per = (area_cut_num[“freqs”].values)*100
labels = [’30平米以下’, ’30-50平米’, ’50-70平米’, ’70-90平米’,
’90-120平米’,’120-140平米’,’140-160平米’,’160平米以上’]
plt.figure(figsize=(20, 8), dpi=100)
plt.axes(aspect=1)
plt.pie(x=area_per, labels=labels, autopct=”%.2f %%”)
plt.legend
plt.show
plt.axes(aspect=1)
设置椭圆
Original: https://blog.csdn.net/weixin_35051623/article/details/114431012
Author: 陈淼淼
Title: python找房源_Python租房信息分析!找到最适合自己的房源信息!
原创文章受到原创版权保护。转载请注明出处:https://www.johngo689.com/756326/
转载文章受原作者版权保护。转载请注明原作者出处!