

上篇文章提到了如何爬取500强的信息,本次我们来讲下如何通过python进行数据分析。 开始前先说个数据,2020年世界500强中国(包含香港和台湾)有133家企业入围,合计GDP达到8.7万亿美元,而中国大陆去年的GDP才14.1万亿美元,头部聚集效应可想而知。下面我们来用Python来看怎么分析这些数据。 本文用示例来讲解如何掌握python数据分析的基本方法
- 一、Python读取文件的方法
- 二、数据的基础描述
- 三、DataFrame 排序、增删行列操作
- 四、DataFrame数据处理:求和、平均数、计数
- 五、DataFrame的增加行列合并操作等
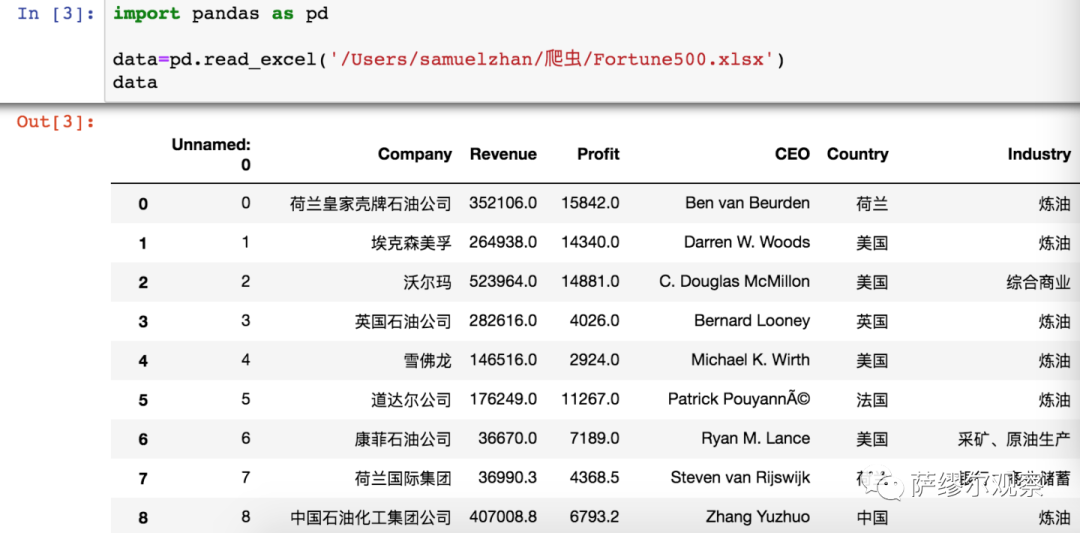
以下为具体内容 一、Python读取文件的方法 Python读取excel文件有以下三种方式,个人推荐Pandas读取法 1、 利用pandas读取 个人比较喜欢直接使用pandas 保存和读取数据,方便好用,特别推荐,只需要三行代码就可以搞定
<code>import pandas as pd</code><code></code><code>data = pd.read_excel('/Users/***/Fortune500.xlsx')</code><code>data</code>

2、 使用xlrd读取Excel 先安装:pip install xlrd,然后读取
<code>import xlrd # 打开文件 data = xlrd.open_workbook('filename.xlsx')</code><code>data.sheet_names() # 获取所有sheet名字 data.sheets</code><code></code><code>data.sheets() # 获取所有sheet对象</code><code>sheet1 = data.sheet_by_name("test") # 通过sheet名查找</code><code>sheet2 = data.sheet_by_index(3) # 通过索引查找</code><code>rows = sheet1.row_values(2)#获取行内容</code><code>cols = sheet1.col_values(3)#获取列内容</code>
3、使用openpyxl库读取Excel 先直接用pip命令安装 openpyxl:pip3 install openpyxl
<code>from openpyxl import load_workbook</code><code></code><code>excel=load_workbook('/test.xlsx')</code><code>table = excel.get_sheet_by_name('Sheet1')</code><code></code><code>rows=table.max_row #获取行数</code><code></code><code>cols=table.max_column #获取列数</code>
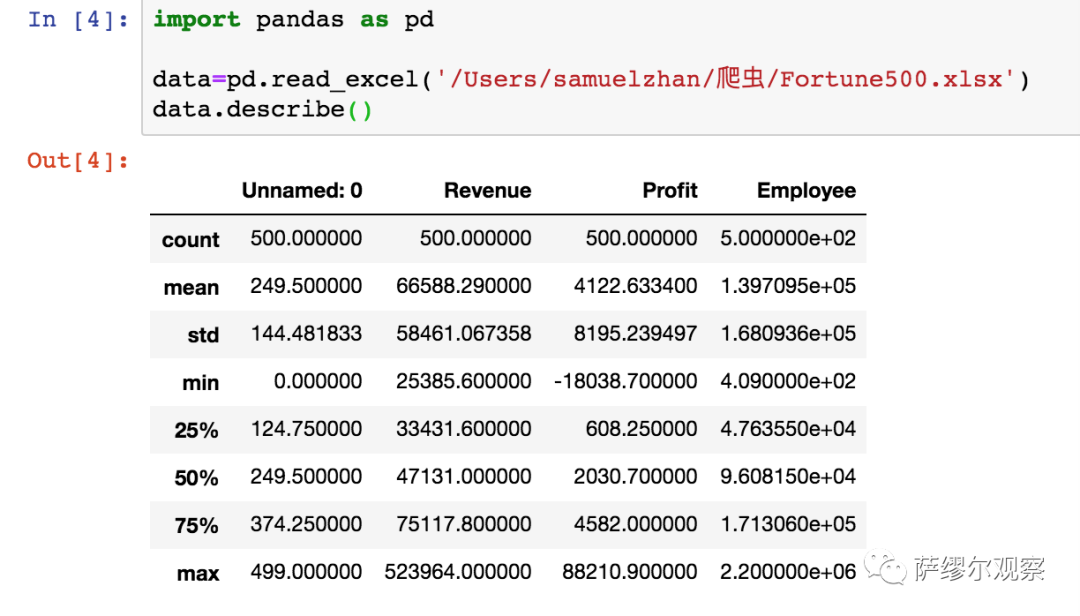
二、数据的基础描述 一般情况下,会使用 describe、dtypes、info、head等函数简单查看数据的情况和质量,是否需要进一步处理
<code>df.describe() #汇总统计</code><code>df.dtypes #数据类型</code><code>data.shape</code><code>data.info()</code><code>data.head() #取前几行</code><code>data.columns #观察列名称</code><code>data.index #观察行名称</code>
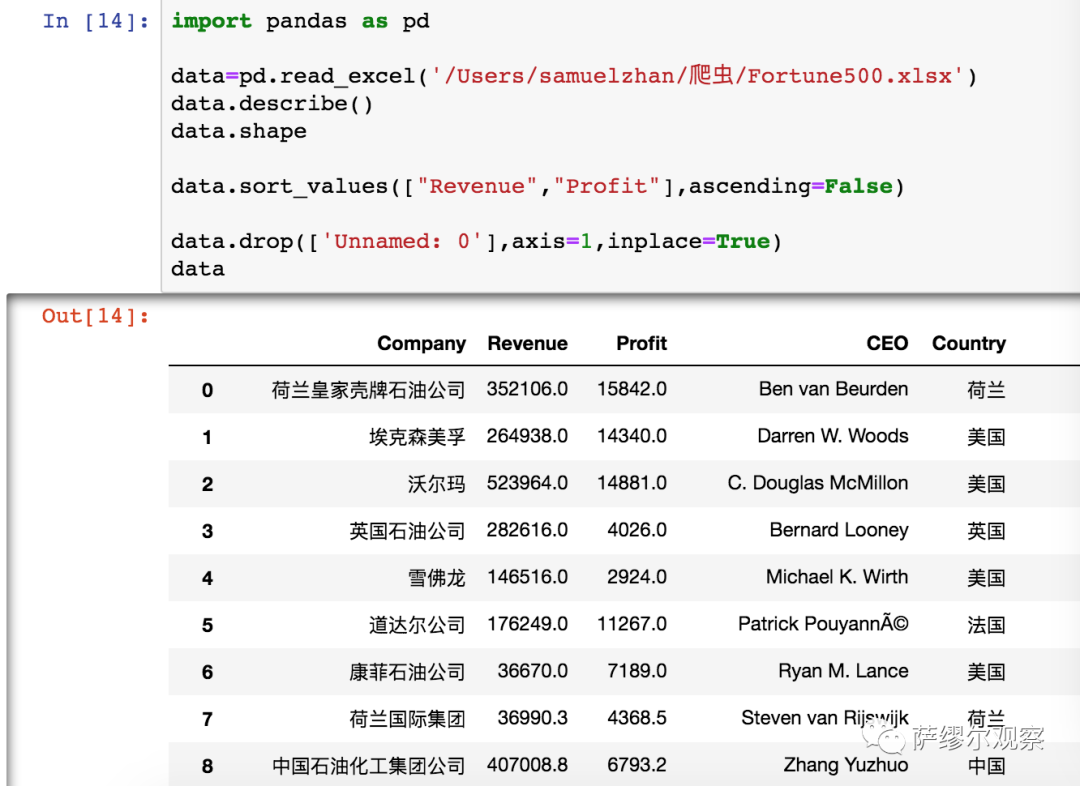
三、DataFrame 排序、增删行列操作 排序: sort_values ([“Revenue”,”Profit”],ascending=False),根据列来降序或者升序排列
<code>import pandas as pd</code><code></code><code>data=pd.read_excel('/Users/samuelzhan/爬虫/Fortune500.xlsx')</code><code>data.describe()</code><code>data.shape</code><code></code><code>data.sort_values(["Revenue","Profit"],ascending=False)</code>

删除列: drop(‘列名’,axis=1,inplace=True) 对比上图即可观察除多余的一列数据被删除
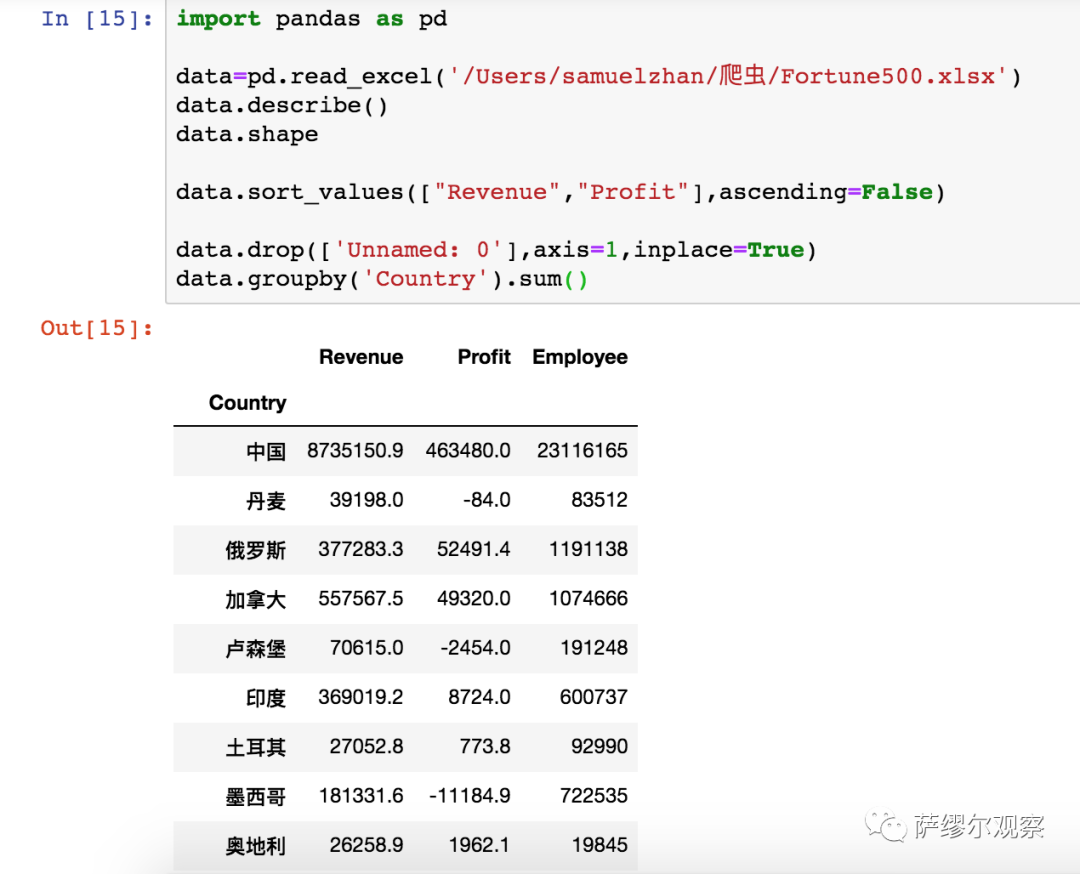
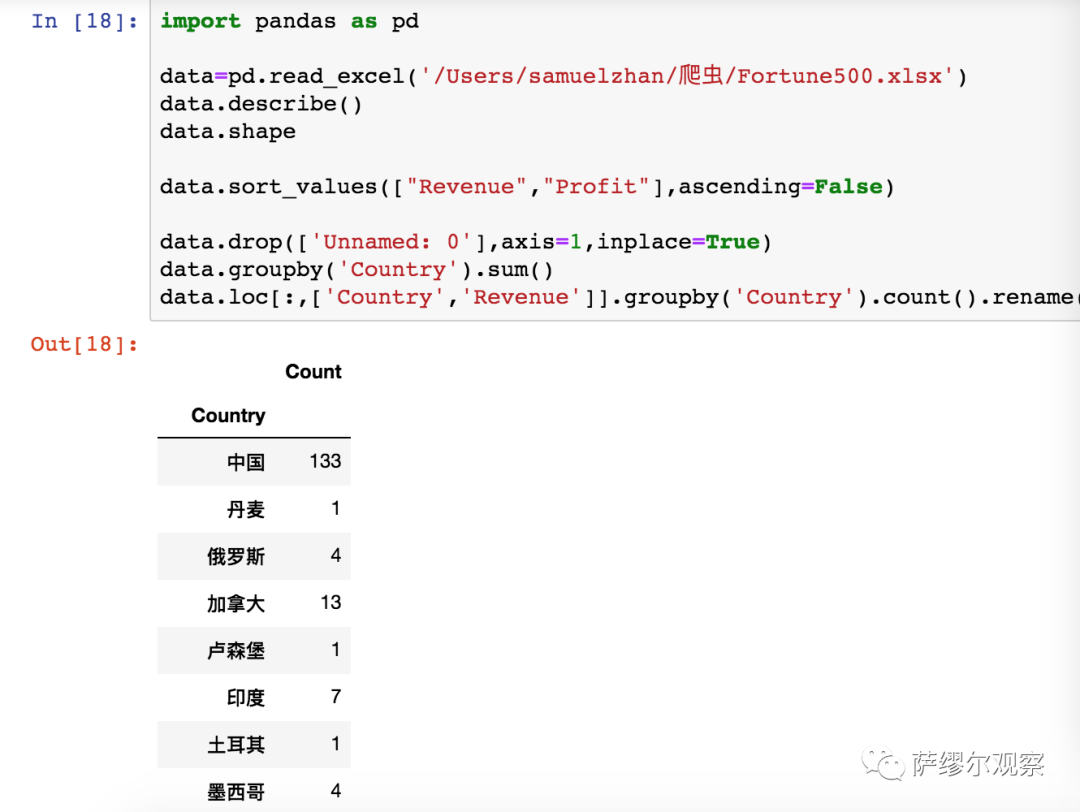
四、DataFrame数据处理:求和、平均数、计数 求和、计数:都是先选择groupby,然后再汇总分析,案例中是根据国家来做汇总分析,你可以根据行业来汇总分析 此外,在做计数统计中为了减少其他多余的数据,只取了 Country和Revenue两列数据,使用的是 data.loc[:,[‘Country’,’Revenue’]],Dataframe中提取行列的方法就不做赘述了。
<code>import pandas as pd</code><code></code><code>data=pd.read_excel('/Users/samuelzhan/爬虫/Fortune500.xlsx')</code><code>data.describe()</code><code>data.shape</code><code></code><code>data.sort_values(["Revenue","Profit"],ascending=False)</code><code></code><code>data.drop(['Unnamed: 0'],axis=1,inplace=True)</code><code>data.groupby('Country').sum()</code><code>data.loc[:,['Country','Revenue']].groupby('Country').count().rename(columns = {"Revenue": "Count"})</code>
五、DataFrame的增加行列合并操作 上面我们可以看到,一张图汇总了 不同国家500强企业的收入、利润、员工人数的汇总;一张图汇总了不同国家500强的数量,那如何让他们在一张表中展示出来呢?
<code>import pandas as pd</code><code></code><code>data=pd.read_excel('/Users/samuelzhan/爬虫/Fortune500.xlsx')</code><code>data.describe()</code><code>data.shape</code><code></code><code>data.sort_values(["Revenue","Profit"],ascending=False)</code><code></code><code>data.drop(['Unnamed: 0'],axis=1,inplace=True)</code><code>s1=data.groupby('Country').sum()</code><code>s2=data.loc[:,['Country','Revenue']].groupby('Country').count().rename(columns = {"Revenue": "Count"})</code><code></code><code></code><code>merge = pd.merge(s1,s2,on=['Country'],how='inner')</code><code>merge.sort_values(by='Count',axis = 0,ascending = False)</code>
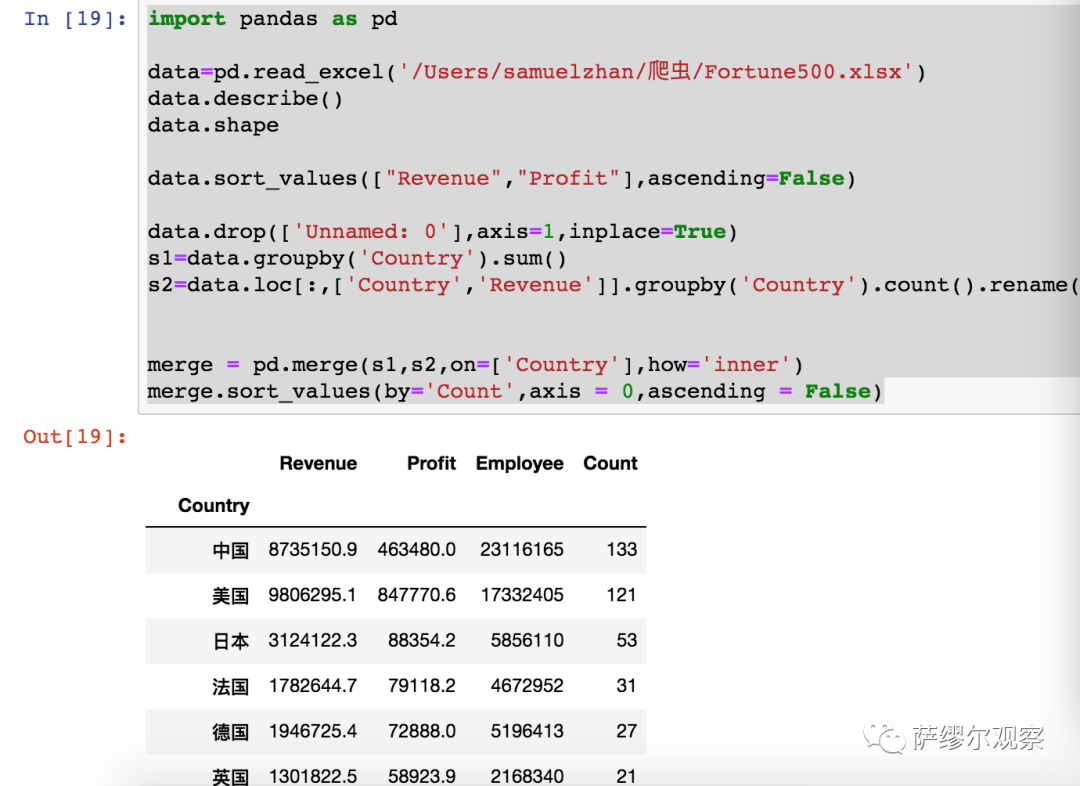
这里使用了Merge的方法,一般表链接有三种方式: 1、merge 相当于SQL中的JOIN。该函数的典型应用场景是,两张表有相同内容的列(即SQL中的键),现在我们想把两张表整合到一张表里。在此典型情况下,结果集的行数并没有增加,列数则为两个元数据的列数和减去连接键的数量。
2、concat 轴向连接。
就是单纯地把两个表拼在一起,这个过程也被称作绑定(binding)或堆叠(stacking)。因此可以想见,这个函数的关键参数应该是 axis,用于指定连接的轴向。axis=1 在行中操作,axis=0是在列中操作。默认是axis=0,即垂直堆叠。
3、join
加上join参数的属性,如果为’inner’得到的是两表的交集,如果是outer,得到的是两表的并集。 以上,用爬取的500强数据,简单说明了Python DataFrame数据处理的基本方法,下次我们再来讲解如何进行可视化操作。
Original: https://blog.csdn.net/weixin_30794639/article/details/113629746
Author: 紫荆银杏
Title: python在数据集data文件中加上属性_Python数据分析基础,看这一篇文章张就可以了…
原创文章受到原创版权保护。转载请注明出处:https://www.johngo689.com/756222/
转载文章受原作者版权保护。转载请注明原作者出处!