

目录
*
– 数据合并之join
– 数据合并之merge
– 分组和聚合
– 索引和复合索引
–
+ 简单的索引操作
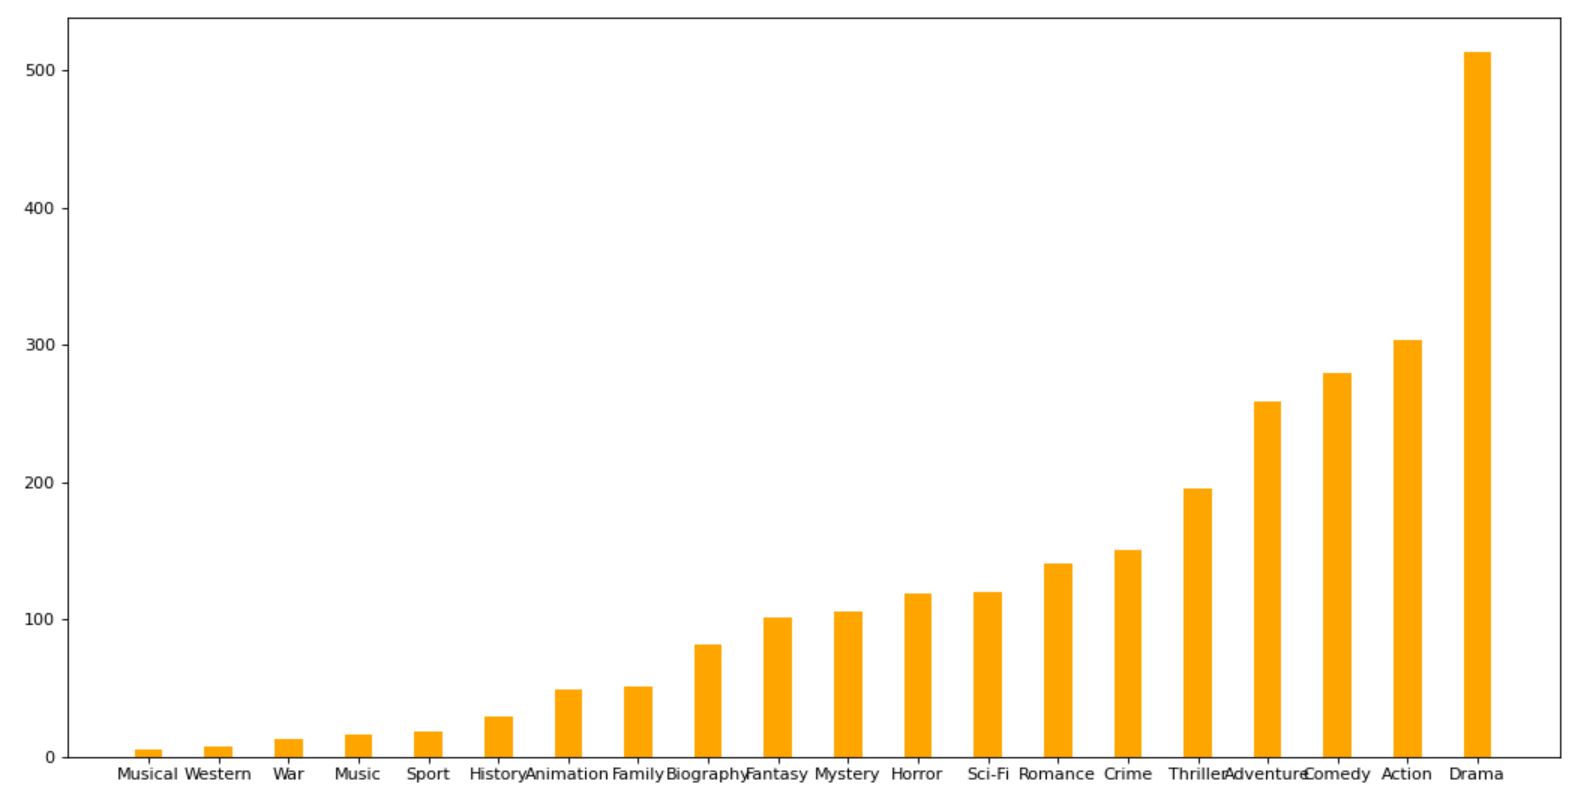
【动手】对于这一组电影数据,如果我们希望统计电影分类(genre)的情况,应该如何处理数据?
import pandas as pd
from matplotlib import pyplot as plt
import numpy as np
file_path = "./IMDB-Movie-Data.csv"
df = pd.read_csv(file_path)
print(df["Genre"].head(3))

temp_list = df["Genre"].str.split(",").tolist()
genre_list = list(set([i for j in temp_list for i in j]))

zeros_df = pd.DataFrame(np.zeros((df.shape[0],len(genre_list))),columns=genre_list)

for i in range(df.shape[0]):

    zeros_df.loc[i,temp_list[i]] = 1

genre_count = zeros_df.sum(axis=0)
print(genre_count)

genre_count = genre_count.sort_values()
_x = genre_count.index
_y = genre_count.values

plt.figure(figsize=(20,8),dpi=80)
plt.bar(range(len(_x)),_y,width=0.4,color="orange")
plt.xticks(range(len(_x)),_x)
plt.show()
运行结果:

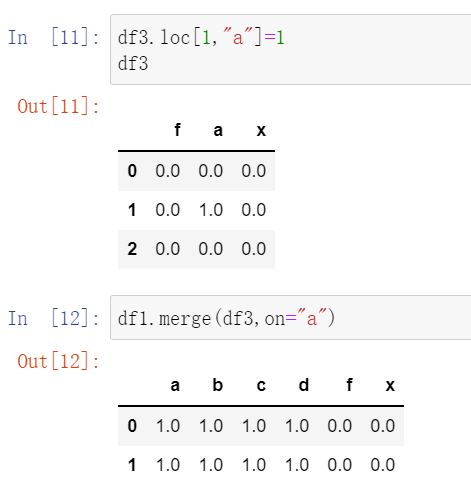
数据合并之join
join:默认情况下他是把行索引相同的数据合并到一起
; 数据合并之merge
merge:按照指定的列把数据按照一定的方式合并到一起
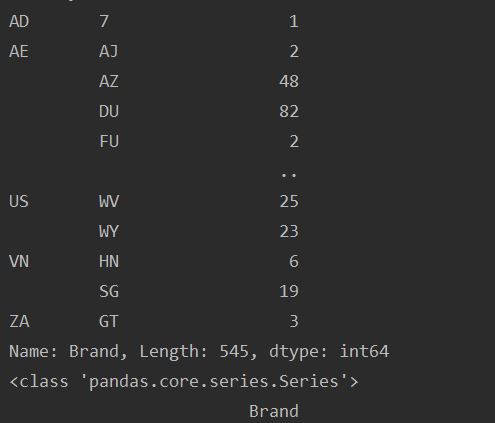
现在我们有一组关于全球星巴克店铺的统计数据,如果我想知道美国的星巴克数量和中国的哪个多,或者我想知道中国每个省份星巴克的数量的情况,那么应该怎么办?
import pandas as pd
import numpy as np
file_path = "./starbucks_store_worldwide.csv"
df = pd.read_csv(file_path)

print(df.info())
china_data = df[df["Country"]=="CN"]
grouped = china_data.groupby(by="State/Province").count()["Brand"]
print(grouped)

分组和聚合
如果我们需要对国家和省份进行分组统计,应该怎么操作呢?
grouped = df.groupby(by=[df[“Country”],df[“State/Province”]])
很多时候我们只希望对获取分组之后的某一部分数据,或者说我们只希望对某几列数据进行分组,这个时候我们应该怎么办呢?
获取分组之后的某一部分数据:
df.groupby(by=[“Country”,”State/Province”])[“Country”].count()
对某几列数据进行分组:
df[“Country”].groupby(by=[df[“Country”],df[“State/Province”]]).count()
继续刚才的问题
import pandas as pd
import numpy as np
file_path = "./starbucks_store_worldwide.csv"
df = pd.read_csv(file_path)
grouped = df["Brand"].groupby(by=[df["Country"],df["State/Province"]]).count()
print(grouped)
print(type(grouped))
grouped1 = df[["Brand"]].groupby(by=[df["Country"],df["State/Province"]]).count()
grouped2= df.groupby(by=[df["Country"],df["State/Province"]])[["Brand"]].count()
grouped3 = df.groupby(by=[df["Country"],df["State/Province"]]).count()[["Brand"]]
print(grouped1,type(grouped1))
print("*"*100)
print(grouped2,type(grouped2))
print("*"*100)
print(grouped3,type(grouped3))
运行结果:
索引和复合索引
简单的索引操作
- 获取index:df.index
- 指定index :df.index = [‘x’,’y’]
- 重新设置index :df.reindex(list(“abcedf”))
- 指定某一列作为index:df.set_index(“Country”,drop=False)
- 返回index的唯一值:df.set_index(“Country”).index.unique()
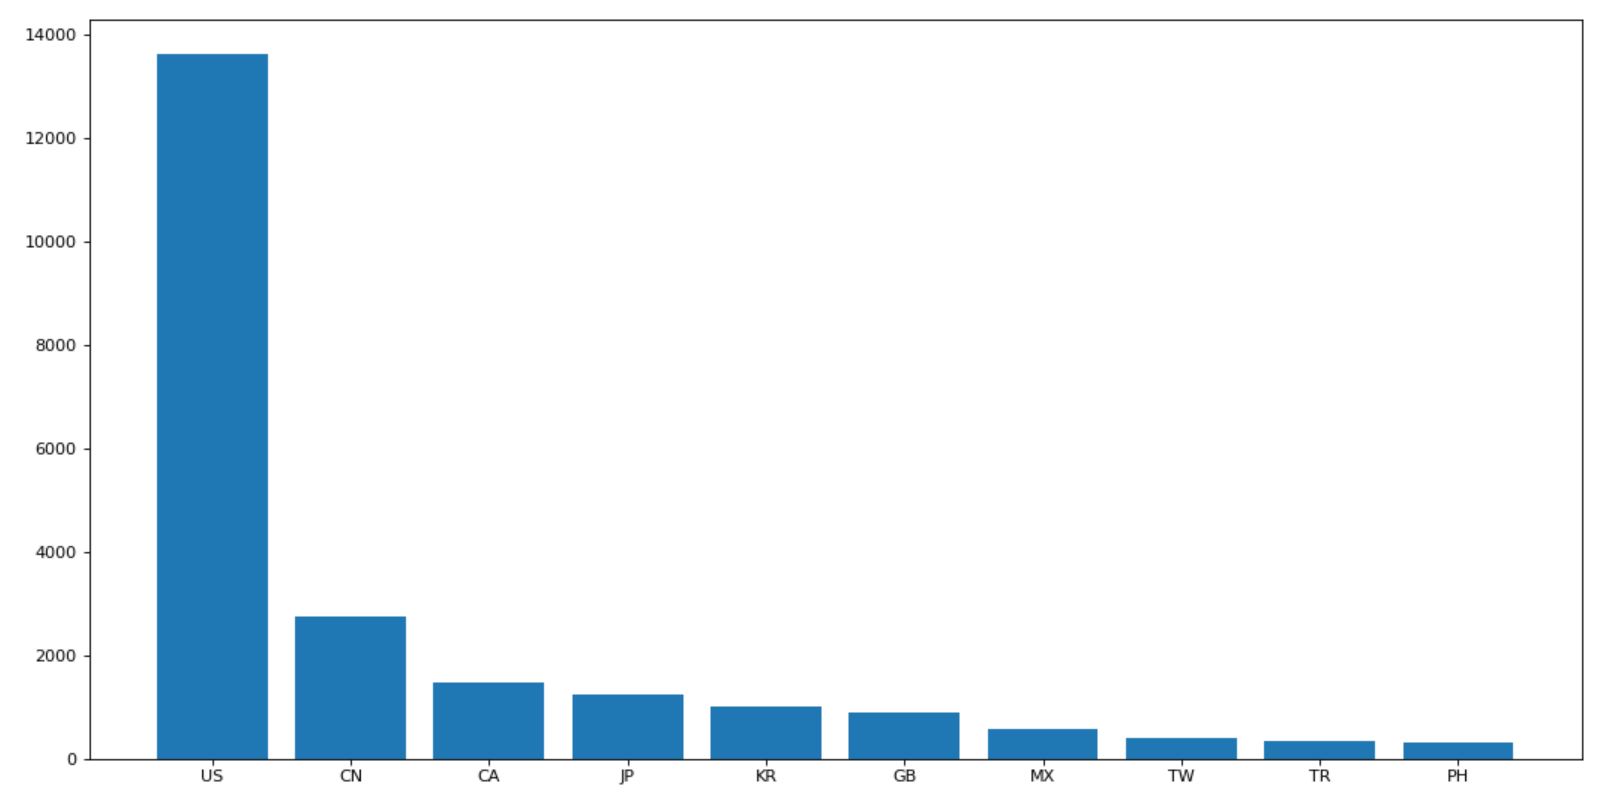
【动手】使用matplotlib呈现出店铺总数排名前10的国家
import pandas as pd
from matplotlib import pyplot as plt
file_path = "./starbucks_store_worldwide.csv"
df = pd.read_csv(file_path)

data1 = df.groupby(by="Country").count()["Brand"].sort_values(ascending=False)[:10]
_x = data1.index
_y = data1.values

plt.figure(figsize=(20,8),dpi=80)
plt.bar(range(len(_x)),_y)
plt.xticks(range(len(_x)),_x)
plt.show()
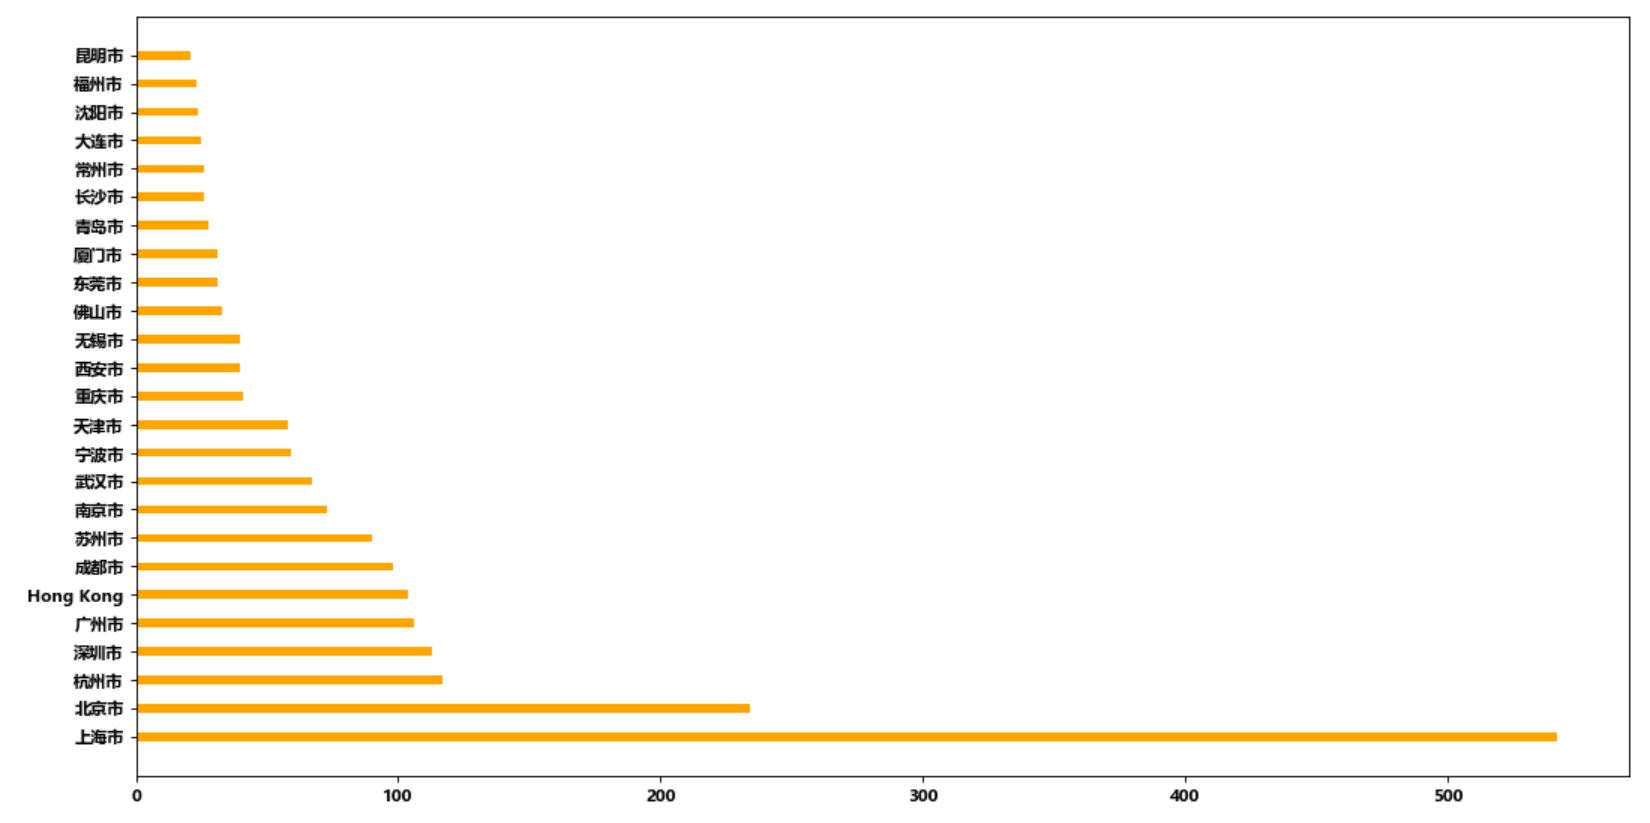
使用matplotlib呈现出每个中国每个城市的店铺数量
import pandas as pd
from matplotlib import pyplot as plt
from matplotlib import font_manager
import matplotlib
my_font = matplotlib.rc('font',family='MicroSoft YaHei',weight='bold')
file_path = "./starbucks_store_worldwide.csv"
df = pd.read_csv(file_path)
df = df[df["Country"]=="CN"

data1 = df.groupby(by="City").count()["Brand"].sort_values(ascending=False)[:25]
_x = data1.index
_y = data1.values

plt.figure(figsize=(20,12),dpi=80)

plt.barh(range(len(_x)),_y,height=0.3,color="orange")
plt.yticks(range(len(_x)),_x,fontproperties=my_font)
plt.show()
运行结果:
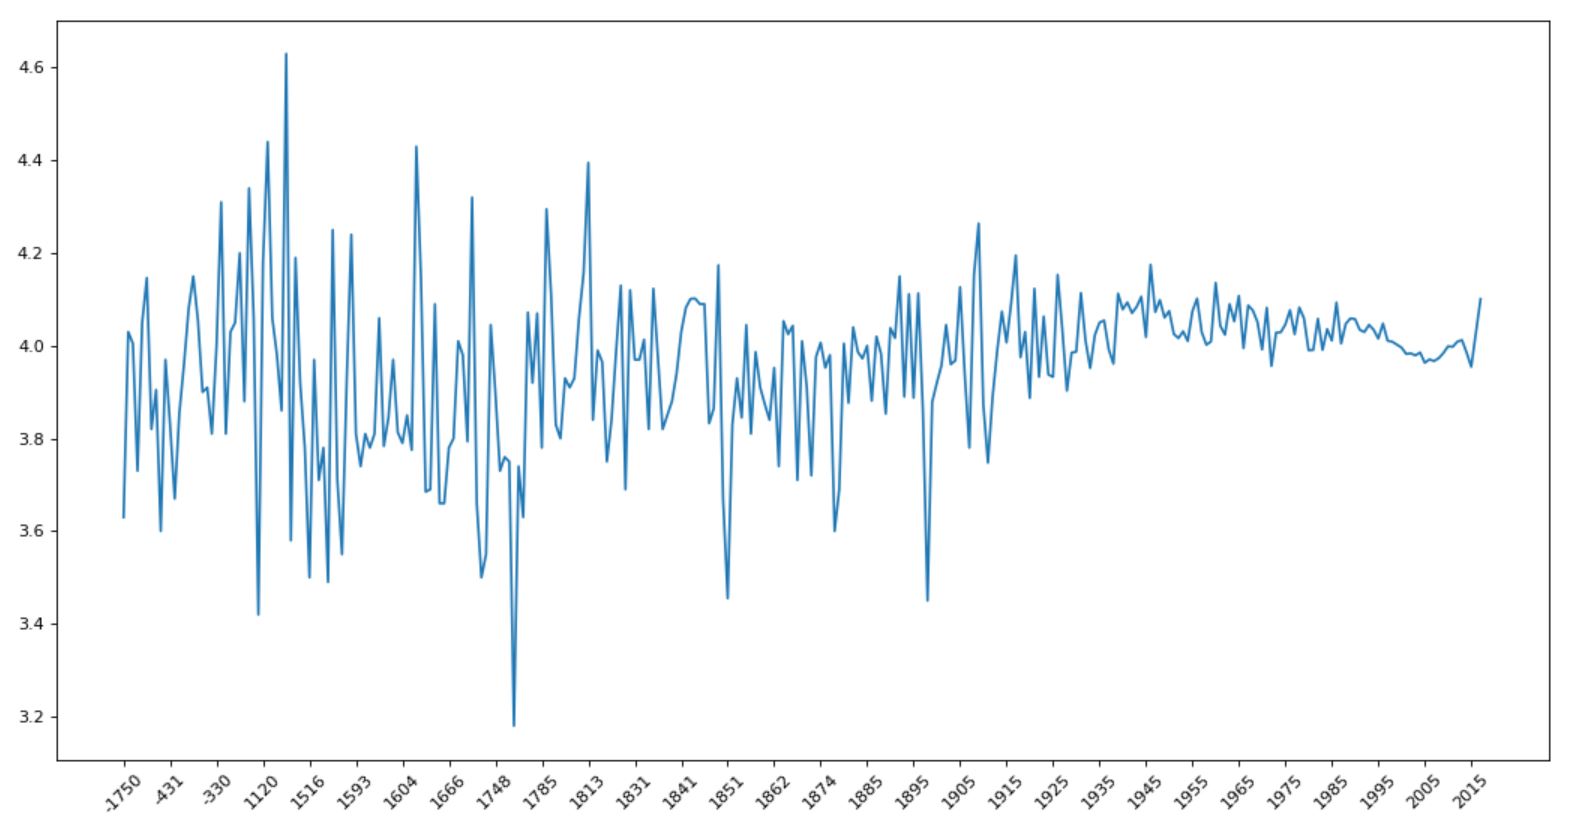
【动手】现在我们有全球排名靠前的10000本书的数据,那么请统计一下下面几个问题:
1.不同年份书的数量
2.不同年份书的平均评分情况
import pandas as pd
from matplotlib import pyplot as plt
file_path = "./books.csv"
df = pd.read_csv(file_path)

data1 = df[pd.notnull(df["original_publication_year"])]
grouped = data1["average_rating"].groupby(by=data1["original_publication_year"]).mean()

_x = grouped.index
_y = grouped.values

plt.figure(figsize=(20,8),dpi=80)
plt.plot(range(len(_x)),_y)
print(len(_x))
plt.xticks(list(range(len(_x)))[::10],_x[::10].astype(int),rotation=45)
plt.show()
运行结果:
Original: https://blog.csdn.net/weixin_45649258/article/details/122989184
Author: 鹿衔草啊
Title: 机器学习-数据科学库第五天—笔记
原创文章受到原创版权保护。转载请注明出处:https://www.johngo689.com/740382/
转载文章受原作者版权保护。转载请注明原作者出处!