

目录
导入
现在我们有一组关于全球星巴克店铺的统计数据,如果我想知道美国的星巴克数量和中国的哪个多,或者我想知道中国每个省份星巴克的数量的情况,那么应该怎么办?
思路:遍历一遍,每次加1 ???
import pandas as pd
import numpy as np

file_path = "./starbucks_store_worldwide.csv"

df = pd.read_csv(file_path)
print(df.head(1))
print(df.info())
grouped = df.groupby(by="Country")
print(grouped)

#DataFrameGroupBy
#可以进行遍历
for i,j in grouped:
   print(i)
数据来源:https://www.kaggle.com /starbucks /store-locations/data
在pandas 中类似的分组的操作我们有很简单的方式来完成
df.groupby (by=”columns_name “)
import pandas as pd
import numpy as np

file_path = "./starbucks_store_worldwide.csv"

df = pd.read_csv(file_path)
grouped = df.groupby(by="Country")
print(grouped)

country_count = grouped["Brand"].count()
print(country_count)
print(country_count["US"])
print(country_count["CN"])

#统计中国每个省店铺的数量
china_data = df[df["Country"] =="CN"]

grouped = china_data.groupby(by="State/Province").count()["Brand"]

print(grouped)
那问题来了,调用groupby 方法之后返回的是什么内容?
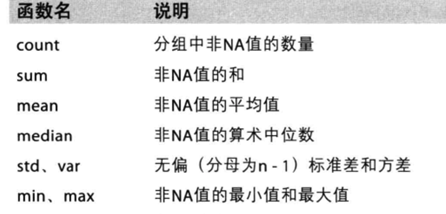
分组和聚合
grouped = df.groupby (by=”columns_name “)
grouped 是一个DataFrameGroupBy 对象,是可迭代的
grouped 中的每一个元素是一个元组
元组里面是(索引(分组的值),分组之后的DataFrame )
DataFrameGroupBy 对象有很多经过优化的方法

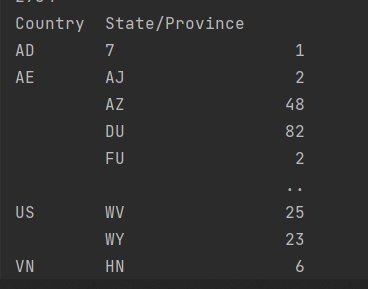
如果我们需要对国家和省份进行分组统计,应该怎么操作呢?
grouped = df.groupby(by=[df["Country"],df["State/Province"]])
获取分组之后的某一部分数据:
df.groupby(by=["Country","State/Province"])["Country"].count()
对某几列数据进行分组:
df["Country"].groupby(by=[df["Country"],df["State/Province"]]).count()
返回值(2个索引)一个Series类型
观察结果,由于只选择了一列数据,所以结果是一个Series类型
如果我想返回一个DataFrame 类型呢?
df[[“Brand”]] 用双方括号取出来是DataFrame类型,以下3种都是DataFrame类型
#数据按照多个条件进行分组,返回DataFrame
grouped1 = df[["Brand"]].groupby(by=[df["Country"],df["State/Province"]]).count()
print(grouped1,type(grouped1))
grouped2= df.groupby(by=[df["Country"],df["State/Province"]])[["Brand"]].count()
grouped3 = df.groupby(by=[df["Country"],df["State/Province"]]).count()[["Brand"]]
print(grouped2,type(grouped2))
print(grouped3,type(grouped3))
索引和复合索引
简单的索引操作:
获取index :df.index
In [19]: t=pd.DataFrame(np.arange(12).reshape((3,4)),index=list(string.ascii_uppercase[:3]),columns=list(string.ascii_uppercase[-4:]))

In [20]: t
Out[20]:
   W  X   Y   Z
A  0  1   2   3
B  4  5   6   7
C  8  9  10  11

In [21]: t.index
Out[21]: Index(['A', 'B', 'C'], dtype='object')
指定index :df.index = [‘x’,’y ‘]
In [22]: t.index=["a","b","c"]

In [23]: t
Out[23]:
   W  X   Y   Z
a  0  1   2   3
b  4  5   6   7
c  8  9  10  11
重新设置index : df.reindex (list(“abcedf “))
 t.reindex(list("abcd"))
Out[26]:
     W    X     Y     Z
a  0.0  1.0   2.0   3.0
b  4.0  5.0   6.0   7.0
c  8.0  9.0  10.0  11.0
d  NaN  NaN   NaN   NaN
指定某一列作为index :df.set_index (“Country”,drop =False)
In [27]: t.set_index("W",drop=False)
Out[27]:
   W  X   Y   Z
W
0  0  1   2   3
4  4  5   6   7
8  8  9  10  11
返回index 的唯一值:df.set_index (“Country”).index.unique ()
In [42]: t=pd.DataFrame(np.ones(12).reshape((3,4)),index=list(string.ascii_uppercase[:3]),columns=list(string.ascii_uppercase[-4:]))

In [43]: t
Out[43]:
     W    X    Y    Z
A  1.0  1.0  1.0  1.0
B  1.0  1.0  1.0  1.0
C  1.0  1.0  1.0  1.0

In [44]: t.set_index("W").index.unique()
Out[44]: Float64Index([1.0], dtype='float64', name='W')
假设a 为一个DataFrame ,那么当a.set_index ([“c”,”d “])即设置两个索引的时候是什么样子的结果呢?
In [46]: t
Out[46]:
   W  X   Y   Z
A  0  1   2   3
B  4  5   6   7
C  8  9  10  11

In [48]: t.set_index(["X","Y"])
Out[48]:
      W   Z
X Y
1 2   0   3
5 6   4   7
9 10  8  11

In [49]: t.set_index(["X","Y"],drop=False)
Out[49]:
      W  X   Y   Z
X Y
1 2   0  1   2   3
5 6   4  5   6   7
9 10  8  9  10  11
我只想取索引h 对应值怎么办?
level相当于是复合索引的里外层,交换了level之后,里外就交换了,索引可以直接从h开始取值
In [8]: x.swaplevel()   #level相当于是复合索引的里外层,交换了level之后,里外就交换了,索引可以直接从h开始取值
Out[8]:
d  c
h  one    0
j  one    1
k  one    2
l  two    3
m  two    4
n  two    5
o  two    6
Name: a, dtype: int64

In [9]: x.swaplevel()["h"]
Out[9]:
c
one    0
Name: a, dtype: int64
那么:DataFrame 是怎样取值呢?
In [11]: x.loc["one"]
Out[11]:
d
h    0
j    1
k    2
Name: a, dtype: int64

In [12]: x.loc["one"].loc["h"]
Out[12]: 0

In [13]: x.swaplevel().loc["j"]
Out[13]:
c
one    1
Name: a, dtype: int64
动手
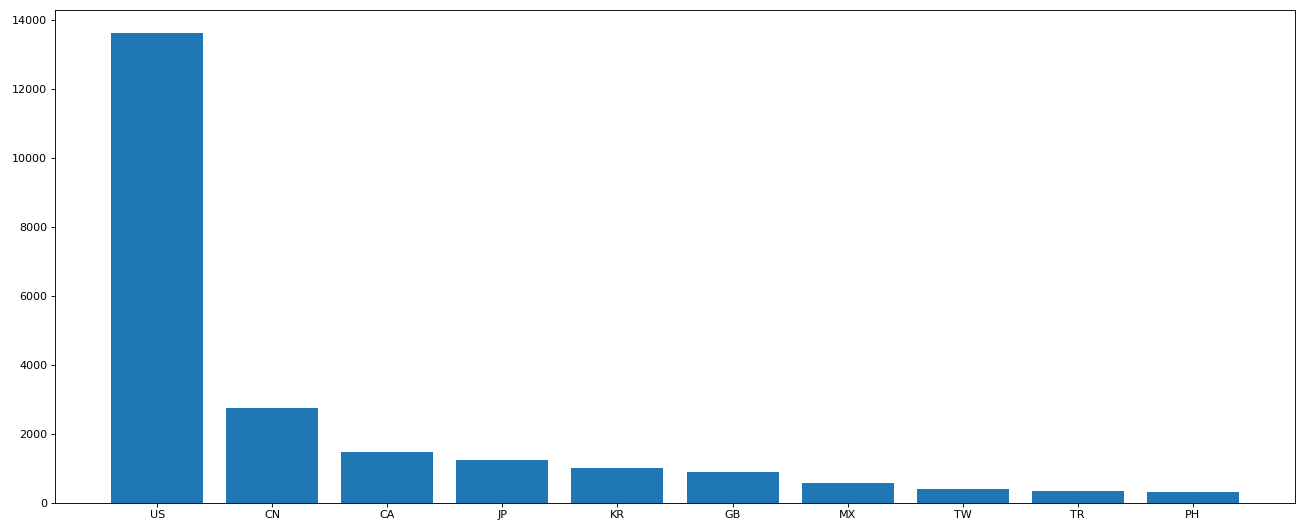
1.使用matplotlib 呈现出店铺总数排名前10 的国家
coding=utf-8
import pandas as pd
from matplotlib import pyplot as plt

file_path = "./starbucks_store_worldwide.csv"

df = pd.read_csv(file_path)

#使用matplotlib呈现出店铺总数排名前10的国家
#准备数据
data1 = df.groupby(by="Country").count()["Brand"].sort_values(ascending=False)[:10]

_x = data1.index
print(_x)
print(len(_x))
print(range(len(_x)))
_y = data1.values

#画图
plt.figure(figsize=(20,8),dpi=80)

plt.bar(range(len(_x)),_y)

plt.xticks(range(len(_x)),_x)

plt.show()
输出图片
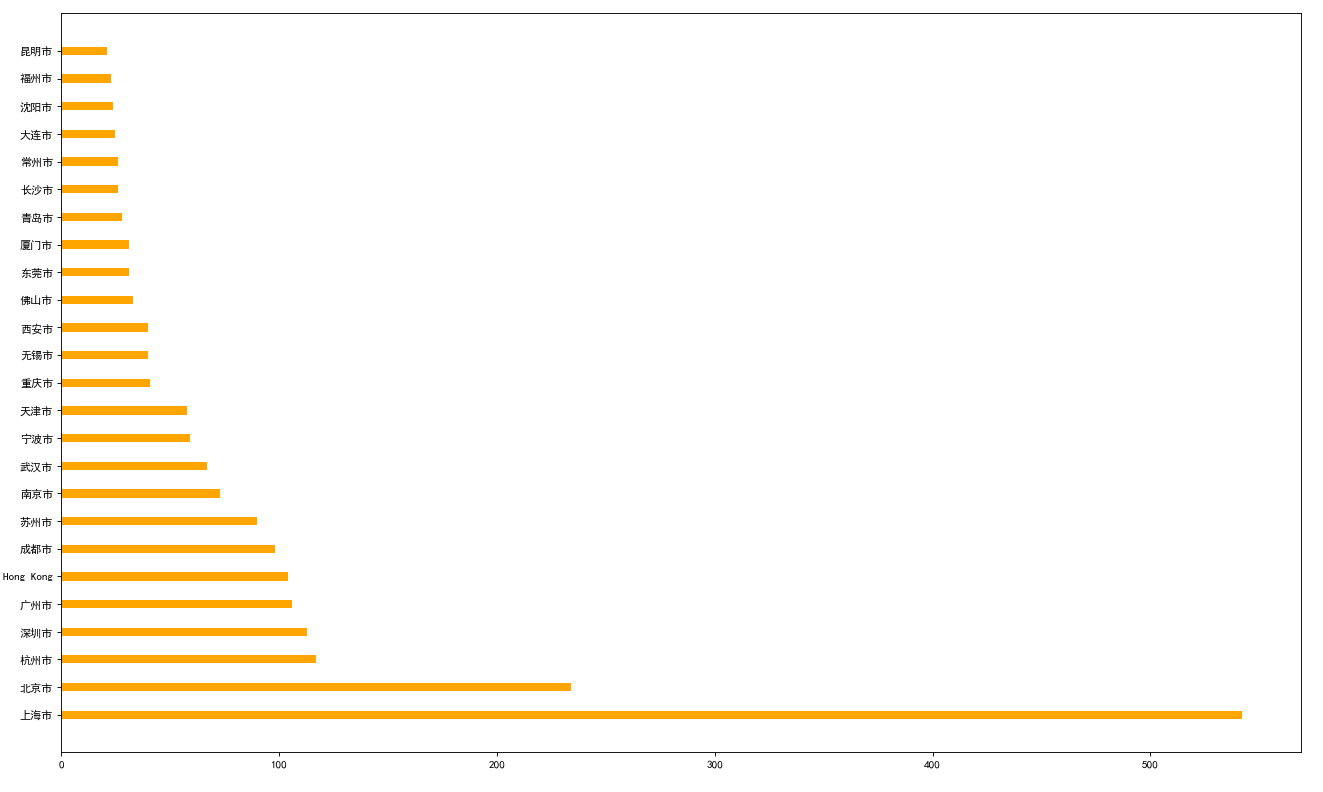
2.使用matplotlib 呈现出每个中国每个城市的店铺数量
coding=utf-8
import pandas as pd
from matplotlib import pyplot as plt
#指定中文识别
plt.rcParams['font.sans-serif'] = ['SimHei']
#获取文件内容
file_path = "./starbucks_store_worldwide.csv"
#读取数据
df = pd.read_csv(file_path)
df = df[df["Country"]=="CN"]

#准备数据
data1 = df.groupby(by="City").count()["Brand"].sort_values(ascending=False)[:25]

_x = data1.index
_y = data1.values

#画图
plt.figure(figsize=(20,12),dpi=80)

plt.bar(range(len(_x)),_y,width=0.3,color="orange")
plt.barh(range(len(_x)),_y,height=0.3,color="orange")

plt.yticks(range(len(_x)),_x)

plt.show()
输出图形
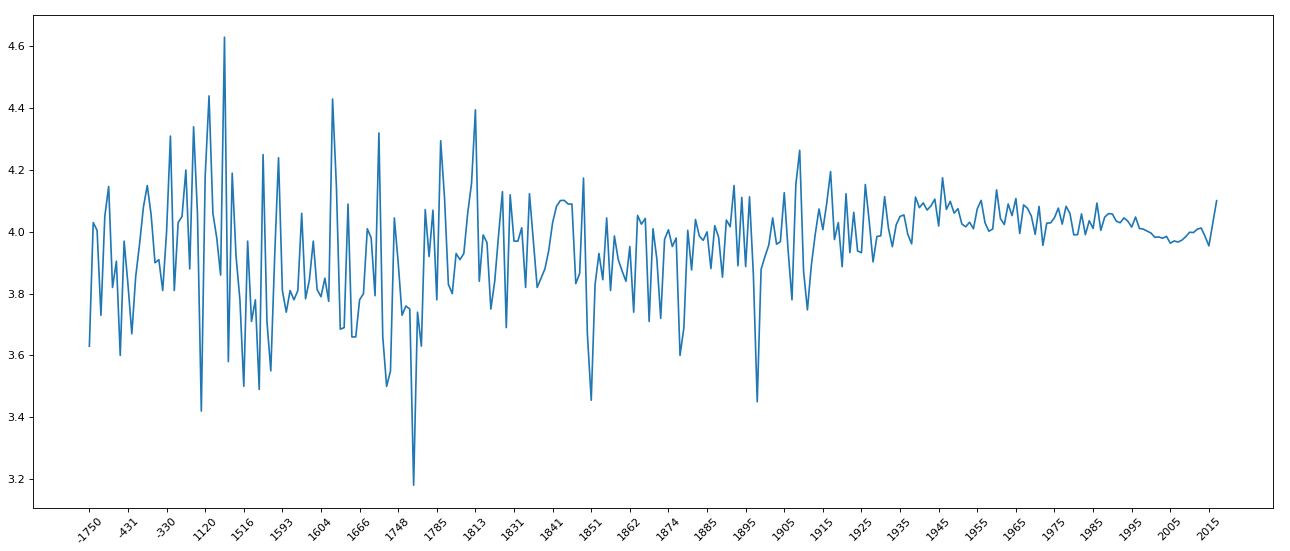
现在我们有全球排名靠前的10000 本书的数据,那么请统计一下下面几个问题:
-
不同年份书的数量
-
不同年份书的平均评分情况
收据来源:https://www.kaggle.com /zygmunt /goodbooks-10k
coding=utf-8
import pandas as pd
from matplotlib import pyplot as plt
#获取数据的位置
file_path="./books.csv"
#读取数据
df=pd.read_csv(file_path)
#print(df.head(2))
#不同年份书的平均评分情况
data1=df[pd.notnull(df["original_publication_year"])]
grouped = data1["average_rating"].groupby(by=data1["original_publication_year"]).mean()
#print(grouped)
_x = grouped.index
_y = grouped.values

#画图
plt.figure(figsize=(20,8),dpi=80)
plt.plot(range(len(_x)),_y)
print(len(_x))
plt.xticks(list(range(len(_x)))[::10],_x[::10].astype(int),rotation=45)
plt.show()
画出图形
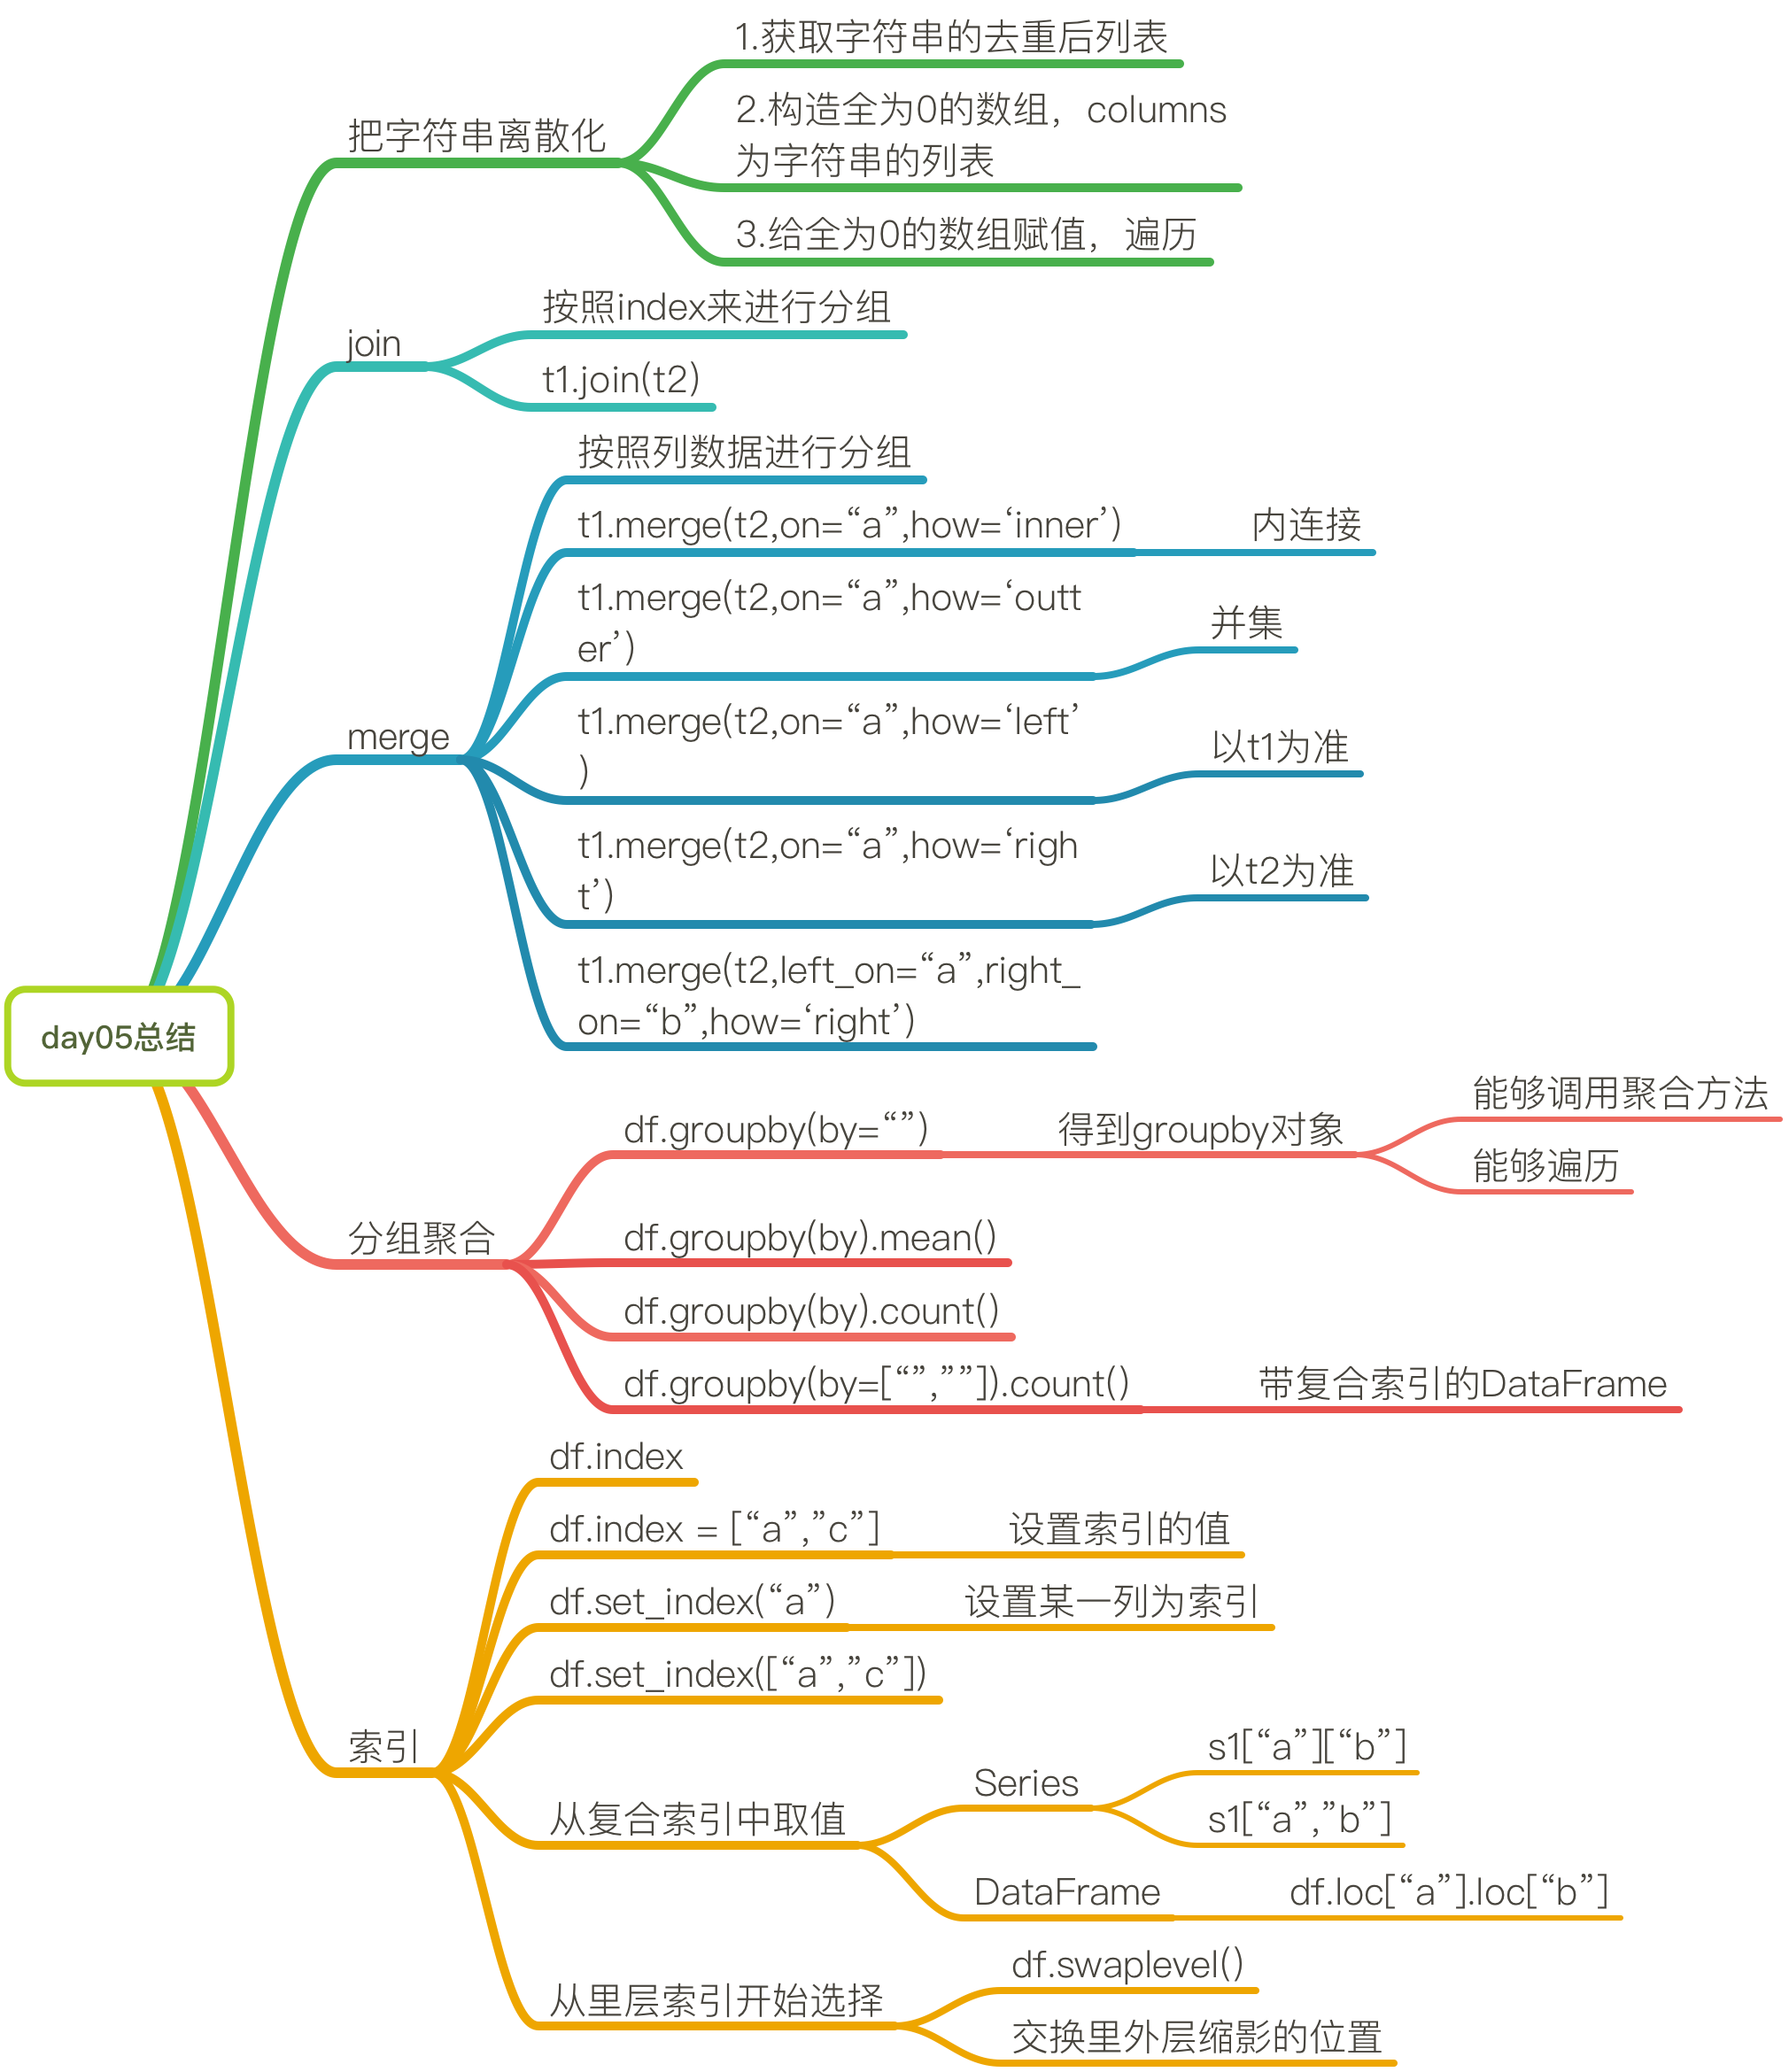
总结
Original: https://blog.csdn.net/Colorfully_lu/article/details/121444725
Author: Colorfully_lu
Title: 数据科学-pandas的分组和聚合
原创文章受到原创版权保护。转载请注明出处:https://www.johngo689.com/678849/
转载文章受原作者版权保护。转载请注明原作者出处!