

1.内容简介
首先通过爬虫采集上所有常熟售房网房源数据,并对采集到的数据进行清洗;然后,对清洗后的数据进行可视化分析,我们可以了解到目前市面上不同地区房源均价及房源分布情况,帮助我们进行购房决策。
2.应用技术介绍
1)Python网络爬虫技术
Scrapy
Xpath
2)Python数据分析技术
Numpy
Matplotlib
Pandas
3) 存储
Mysql
Redis
3.房源数据采集
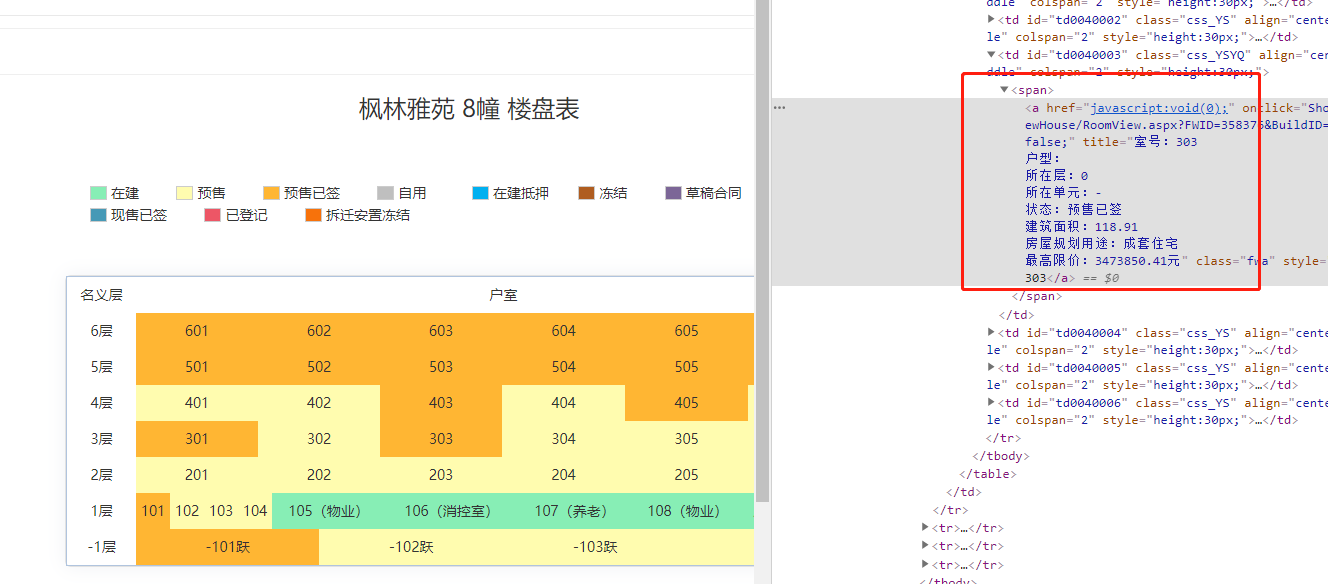
1)分析网站


可以看到上面可见的有四个区域,后面数据跑完发现抓取到一个其他区域(不在列表上)
可以看到有用数据大概就这些,将其存储到数据库。
2)存储到数据库的部分字段数据
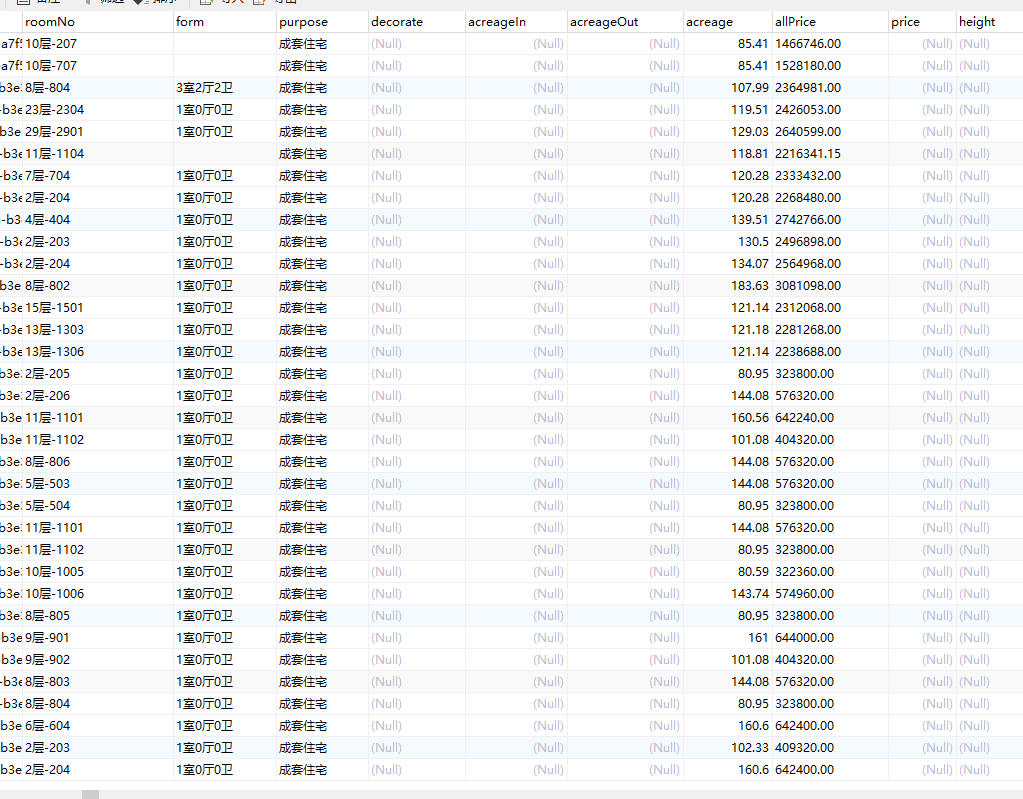
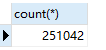
有251042条数据
比较简单,代码此处就不贴出来了。
4.数据可视化
在数据清洗完成后,我们就可以开始对数据进行可视化分析。该阶段主要是对数据做一个探索性分析并将结果可视化呈现,帮助人们更好、更直观的认识数据,把隐藏在大量数据背后的信息集中和提炼出来。本文主要对房源的总价地区等属性进行了分析。
数据可视化分析主要步骤如下:
1) 首先将数据写入csv文件
代码如下:
import pymysql
import pandas as pd
from study_nlp.settings import local_db_config, column_list, use_list, changshu_areaDict, QUERY_SQL
import matplotlib.pyplot as plt

class WriteToCsv(object):

    def __init__(self, areaId):
        self.areaId = areaId
        self.conn = pymysql.Connect(**local_db_config)
        self.cursor = self.conn.cursor()

    def __del__(self):
        self.cursor.close()
        self.conn.close()

    def read(self):
        query_sql = QUERY_SQL.format(self.areaId)
        self.cursor.execute(query_sql)
        datas = self.cursor.fetchall()
        return datas

    def write(self):

        df = pd.DataFrame(self.read(), columns=column_list)

        df = df.loc[:, use_list]

        pd.DataFrame.to_csv(df, f"./changshu_{changshu_areaDict.get(self.areaId)}.csv", encoding='utf-8')
        print('{}数据写入成功'.format(changshu_areaDict.get(self.areaId)))
将其封装:
def store_data():
    for areaId in changshu_areaDict.keys():
        test = WriteToCsv(areaId)
        test.write()

if __name__ == '__main__':

    store_data()
运行结果:

这是数据已经写入到csv文件中了


2) 计算总价均价,并绘制成折线图
代码如下:
def average(area):
    data = pd.read_csv(f"./changshu_{area}.csv", encoding='utf-8')

    print('{}房屋均价为{}'.format(area, data['allPrice'].mean().round(2)))
    return data['allPrice'].mean().round(2)

def show_chart(area_list, average_allPrice_list):
    df = pd.DataFrame({'area': area_list, 'average': average_allPrice_list})
    fig, ax = plt.subplots()
    ax.plot(df['area'], df['average'], 'b')
    ax.plot(df['area'], df['average'], 'or', markersize=3)

    for x, y in zip(area_list, average_allPrice_list):
        plt.text(x, y, y, ha='center', va='bottom', fontsize=10)
    ax.set_ylim(0, 5000000
                )

    plt.rcParams['font.sans-serif'] = ['SimHei']

    plt.rcParams['axes.unicode_minus'] = False

    plt.title('常熟各地区房屋每套均价', fontsize=16)

    plt.xlabel('地区', fontsize=13)

    plt.ylabel('均价/元', fontsize=13)

    plt.savefig('./changshu.png')

    plt.show()

if __name__ == '__main__':

    area_list = list(changshu_areaDict.values())

    average_allPrice_list = []

    for area in area_list:
        average_allPrice_list.append(average(area))

    show_chart(area_list, average_allPrice_list)
运行结果:

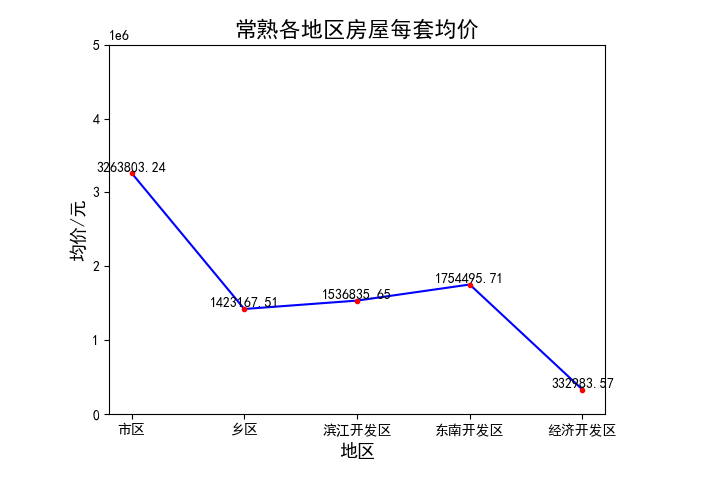
生成折线图:
完整代码:
import pymysql
import pandas as pd
from study_nlp.settings import local_db_config, column_list, use_list, changshu_areaDict, QUERY_SQL
import matplotlib.pyplot as plt

class WriteToCsv(object):

    def __init__(self, areaId):
        self.areaId = areaId
        self.conn = pymysql.Connect(**local_db_config)
        self.cursor = self.conn.cursor()

    def __del__(self):
        self.cursor.close()
        self.conn.close()

    def read(self):
        query_sql = QUERY_SQL.format(self.areaId)
        self.cursor.execute(query_sql)
        datas = self.cursor.fetchall()
        return datas

    def write(self):

        df = pd.DataFrame(self.read(), columns=column_list)

        df = df.loc[:, use_list]

        pd.DataFrame.to_csv(df, f"./changshu_{changshu_areaDict.get(self.areaId)}.csv", encoding='utf-8')
        print('{}数据写入成功'.format(changshu_areaDict.get(self.areaId)))

def store_data():
    for areaId in changshu_areaDict.keys():
        test = WriteToCsv(areaId)
        test.write()

def average(area):
    data = pd.read_csv(f"./changshu_{area}.csv", encoding='utf-8')

    print('{}房屋均价为{}'.format(area, data['allPrice'].mean().round(2)))
    return data['allPrice'].mean().round(2)

def show_chart(area_list, average_allPrice_list):
    df = pd.DataFrame({'area': area_list, 'average': average_allPrice_list})
    fig, ax = plt.subplots()
    ax.plot(df['area'], df['average'], 'b')
    ax.plot(df['area'], df['average'], 'or', markersize=3)

    for x, y in zip(area_list, average_allPrice_list):
        plt.text(x, y, y, ha='center', va='bottom', fontsize=10)
    ax.set_ylim(0, 5000000
                )

    plt.rcParams['font.sans-serif'] = ['SimHei']

    plt.rcParams['axes.unicode_minus'] = False

    plt.title('常熟各地区房屋每套均价', fontsize=16)

    plt.xlabel('地区', fontsize=13)

    plt.ylabel('均价/元', fontsize=13)

    plt.savefig('./changshu.png')

    plt.show()

if __name__ == '__main__':

    store_data()

    area_list = list(changshu_areaDict.values())

    average_allPrice_list = []

    for area in area_list:
        average_allPrice_list.append(average(area))

    show_chart(area_list, average_allPrice_list)
总结:
常熟不同地区房屋均价很明显,当然这只是大概,没有根据房屋类型分类,数据不是很精确,但是应该可以看出一点点吧,各位。
本文章全系对技术的兴趣爱好,欢迎大家学习交流。
Original: https://blog.csdn.net/weixin_44275079/article/details/115215500
Author: 晨曦gh
Title: python数据分析-基于Python的房屋均价数据可视化分析
原创文章受到原创版权保护。转载请注明出处:https://www.johngo689.com/675101/
转载文章受原作者版权保护。转载请注明原作者出处!