

本文演示了如何对分类数组中的数据绘图。
加载样本数据
加载从 100 位患者收集的样本数据。
load patients

whos
  Name                            Size            Bytes  Class      Attributes

  Age                           100x1               800  double
  Diastolic                     100x1               800  double
  Gender                        100x1             11412  cell
  Height                        100x1               800  double
  LastName                      100x1             11616  cell
  Location                      100x1             14208  cell
  SelfAssessedHealthStatus      100x1             11540  cell
  Smoker                        100x1               100  logical
  Systolic                      100x1               800  double
  Weight                        100x1               800  double
基于字符向量元胞数组创建分类数组
工作区变量 Location 是一个字符向量元胞数组,它包含患者就医的三个唯一医疗机构。
为了更方便地访问和比较数据,请将 Location 转换为一个分类数组。
Location = categorical(Location);
汇总分类数组。
summary(Location)
     County General Hospital        39
     St. Mary's Medical Center      24
     VA Hospital                    37
39 位患者在 County General Hospital 就医,24 位患者在 St. Mary’s Medical Center 就医,37 位患者在 VA Hospital 就医。
工作区变量 SelfAssessedHealthStatus 包含四个唯一值 Excellent、Fair、Good 和 Poor。
将 SelfAssessedHealthStatus 转换为一个有序分类数组,这样这些类别采用数学排序 Poor < Fair < Good < Excellent。
SelfAssessedHealthStatus = categorical(SelfAssessedHealthStatus,...

    {'Poor' 'Fair' 'Good' 'Excellent'},'Ordinal',true);
汇总分类数组 SelfAssessedHealthStatus。
summary(SelfAssessedHealthStatus)
     Poor           11
     Fair           15
     Good           40
     Excellent      34
绘制直方图
直接基于分类数组创建一个直方条形图。
figure
histogram(SelfAssessedHealthStatus)
title('Self Assessed Health Status From 100 Patients')
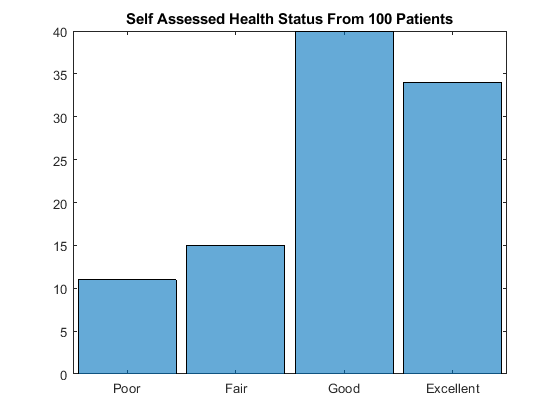

函数 histogram 接受分类数组 SelfAssessedHealthStatus,并对四个类别中的每一个类别绘制类别计数。
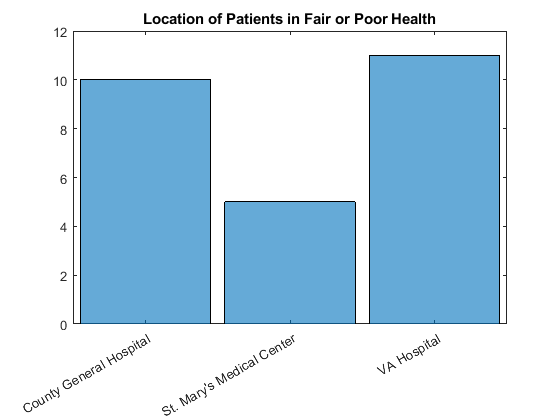
仅为健康状况评估为 Fair 或 Poor 的患者绘制医院位置直方图。
figure
histogram(Location(SelfAssessedHealthStatus'Fair'))
title('Location of Patients in Fair or Poor Health')
创建饼图
从分类数组直接创建饼图。
figure
pie(SelfAssessedHealthStatus);
title('Self Assessed Health Status From 100 Patients')
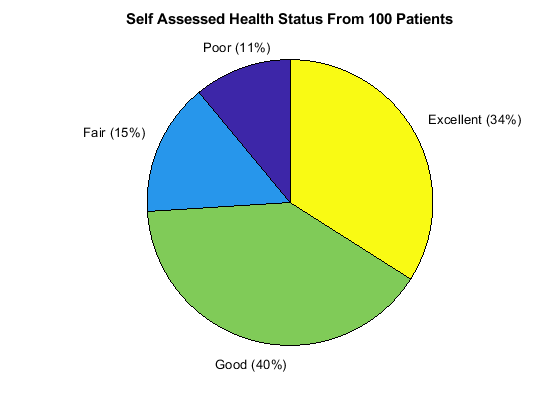
函数 pie 接受分类数组 SelfAssessedHealthStatus,并绘制了一个包含四个类别的饼图。
创建帕累托图
根据 SelfAssessedHealthStatus 的四个类别各自的类别计数创建帕累托图。
figure
A = countcats(SelfAssessedHealthStatus);
C = categories(SelfAssessedHealthStatus);
pareto(A,C);
title('Self Assessed Health Status From 100 Patients')
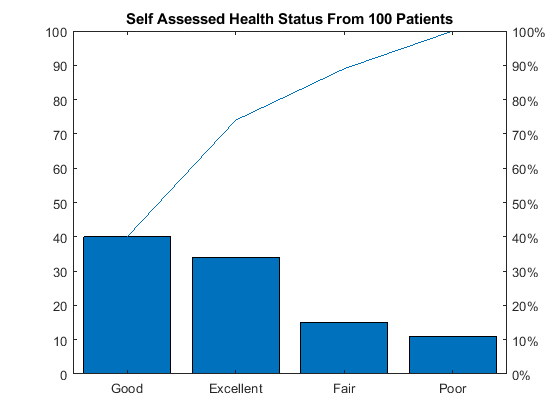
pareto 的第一个输入参数必须是向量。如果分类数组为矩阵或多维数组,则在调用 countcats 和 pareto 之前将其重构为向量。
创建散点图
将字符向量元胞数组转换为分类数组。
Gender = categorical(Gender);
汇总分类数组 Gender。
summary(Gender)
     Female      53
     Male        47
Gender 是一个 100×1 的分类数组,包含两个类别 Female 和 Male。
使用分类数组 Gender 分别访问每种性别的 Weight 和 Height。
X1 = Weight(Gender=='Female');
Y1 = Height(Gender=='Female');

X2 = Weight(Gender=='Male');
Y2 = Height(Gender=='Male');
X1 和 Y1 是 53×1 的数值数组,包含女性患者的数据。
X2 和 Y2 是 47×1 的数值数组,包含男性患者的数据。
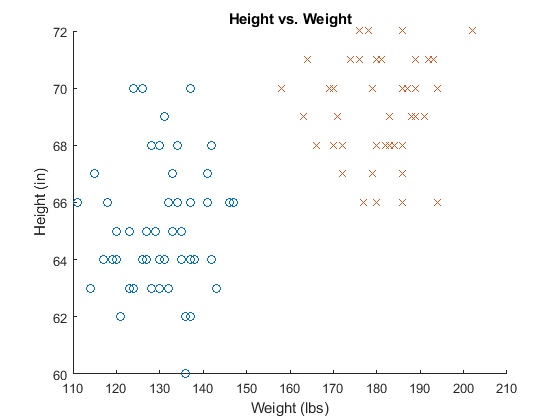
创建一个身高与体重的散点图。使用一个圈指示女性患者的数据,使用一个叉指示男性患者的数据。
figure
h1 = scatter(X1,Y1,'o');
hold on
h2 = scatter(X2,Y2,'x');

title('Height vs. Weight')
xlabel('Weight (lbs)')
ylabel('Height (in)')
Original: https://blog.csdn.net/u013883025/article/details/117621883
Author: 结冰架构
Title: MATLAB 基础知识 数据类型 分组数组 对分类数据绘图
原创文章受到原创版权保护。转载请注明出处:https://www.johngo689.com/667239/
转载文章受原作者版权保护。转载请注明原作者出处!