

一、背景
聚类最难得就是确定最佳的聚类数,下面介绍几种方法。
二、确定最佳聚类数
2.1 轮廓系数(Silhouette)
Silhouette系数是对聚类结果有效性的解释和验证,由Peter J. Rousseeuw于1986提出。
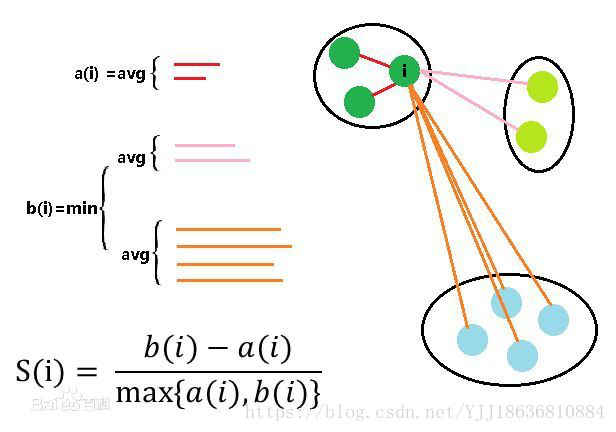
图解原理如下:

具体方法如下:
-
计算簇内不相似度
-
计算样本i i i 到同簇其他样本的平均距离a i a_i a i 。a i a_i a i 越小,说明样本i i i 越应该被聚类到该簇。将a i a_i a i 称为样本i i i 的
簇内不相似度。 -
簇C中所有样本的a i 均值称为簇C的簇不相似度。
-
计算簇间不相似度
-
计算样本i i i 到其他某簇C j C_j C j 的所有样本的平均距离b i j b_{ij}b i j ,称为样本i i i 与簇C j C_j C j 的不相似度。定义为样本i i i 的簇间不相似度:b i = m i n { b i 1 , b i 2 , . . . , b i k } b_i =min{b_{i1}, b_{i2}, …, b_{ik}}b i =m i n {b i 1 ,b i 2 ,…,b i k }
-
b i b_i b i 越大,说明样本i i i 越不属于其他簇。
-
计算轮廓系数
-
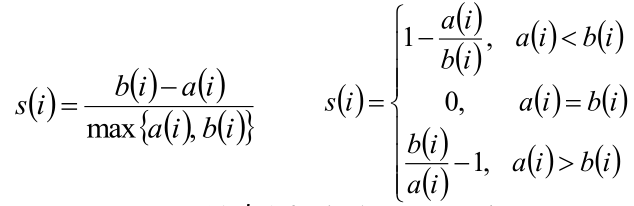
根据样本i的簇内不相似度a i a_i a i 和簇间不相似度b i b_i b i ,定义样本i i i 的轮廓系数:
-
判断:
-
s i s_i s i 接近1,则说明样本i i i 聚类合理;
- s i s_i s i 接近-1,则说明样本i i i 更应该分类到另外的簇;
- s i s_i s i 近似为0,则说明样本i i i 在两个簇的边界上。
; 2.2 离散度(Dispersion score)
2.2.1 定义
The dispersion coefficient is based on the consensus matrix (i.e. the average of connectivity matrices) and was proposed by Kim et al. (2007) to measure the reproducibility of the clusters obtained from NMF.
it is defined as:
ρ = ∑ i , j = 1 n 4 ( C i j − 1 2 ) 2 ρ = ∑{i,j=1}^n 4 (C{ij} – \frac{1}{2})^2 ρ=i ,j =1 ∑n 4 (C i j −2 1 )2
where n is the total number of samples.
By construction, 0 ≤ ρ ≤ 1 0 \leq \rho \leq 1 0 ≤ρ≤1 and ρ = 1 \rho =1 ρ=1 only for a perfect consensus matrix, where all entries 0 or 1. A perfect consensus matrix is obtained only when all the connectivity matrices are the same, meaning that the algorithm gave the same clusters at each run. See Kim et al. (2007).
2.2.2 Consensus matrix
谈到consensus matrix,不得不讨论一下共识聚类(一致性聚类)。共识聚类是为不同的聚类算法,选择最优的聚类数量(K)。其具体的原理是:基于有放回地重采样方法,考量任意一个数据在不同样本中聚类表现的一致性来确定聚类的参数是否合适。
通俗的步骤理解为:*
第一步:从原始数据中随机抽取子集,当然子集的规模不能太小,最好是原始数据集的半数以上,子集要尽量多,以确保里面的每一个数据都多次被取到(100次以上)。然后,将聚类方法(可以使K-means或者层次聚类应用于所有的数据子集,执行分别聚类。第二步:这一步的关键在于建立一个新的矩阵:consensus matrix。我们之前说聚类的输入通常是一个distance matrix。 那么consensus matrix怎么建呢?假设有D 1 , D 2 , . . . D n D_1,D_2, . . . D_n D 1 ,D 2 ,…D n 等N N N 个数据,那么consensus matrix是N × N N \times N N ×N 的方阵。
D1D2…DnD1C11C12…C1nD2C11C12…C2n………Cij…DnCn1Cn2…Cnn
其中,C i j C_{ij}C i j 代表的是在多次的聚类过程中,数据 D i D_i D i 和数据 D j D_j D j 被聚到同一类里面的概率(该值在0和1之间,等于1代表100次聚类这两个数据点全部在同一个类里面,等于0代表代表100次聚类全部不在同一个类里面。
那么,好的聚类方法会得到怎么样的consensus matrix呢?对了,全部由0或1组成的方阵,代表着那些很像的数据总在一类,而不像的数据则总是不在一类,这正符合了聚类的初衷是吧。
第三步:再对consensus matrix做一次聚类(这里用层次聚类方便可视化),只有0和1的矩阵,就让是1的都聚在一起,而0的都分开来,用heatmap看起来就是下面这样的。

; 2.3 共表型相关系数(Cophenetic correlation)
在基于NMF的聚类中,共表型相关性系数的计算是:
-
The cophenetic correlation coeffificient is based on the consensus matrix (i.e. the average of con- nectivity matrices) and was proposed by Brunet et al. (2004) to measure the stability of the clusters obtained from NMF.
-
It is defined as the Pearson correlation between the samples’ distances induced by the consensus matrix (seen as a similarity matrix) and their cophenetic distances from a hierachical clustering based on these very distances (by default an average linkage is used). See Brunet et al. (2004).
Cophenetic Coefficient
How good is the clustering that we just performed? There is an index called Cross Correlation or Cophenetic Correlation Coefficient (CP) that shows the goodness of fit of our clustering similar to the Correlation Coefficient of regression.
To compute the Cophenetic Correlation Coefficient of hierarchical clustering, we need two informations:
- Distance matrix
- Cophenetic matrix
基于层次聚类的方式计算共表型相关系数。
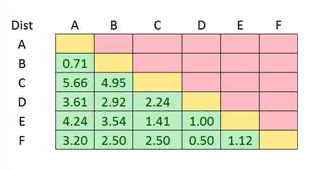
- 第一步:基于距离相似度(如欧几里德距离)计算样本间的距离相似值(distance matrix)。
这里我们仅展示左下角的距离矩阵。
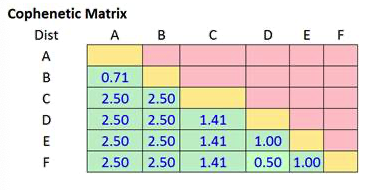
- 第二步:基于层次聚类算法,计算cophenetic matrix
首先,基于层次聚类中single linkage算法,计算归类后的”加权”距离。

其次,基于”加权”的距离,构建cophenetic matrix
- 第三步:基于distance matrix和cophenetic matrix,计算相关性(如,pearson相关性)
首先,将两个距离矩阵表进行整合(如下):
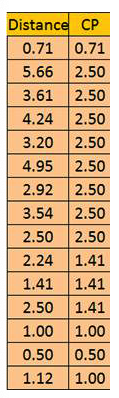
其次,计算相关性(如pearson相关性)
Cophenetic Correlation Coefficient is simply correlation coefficient between distance matrix and Cophenetic matrix = Correl (Dist, CP) = 86.399%. As the value of the Cophenetic Correlation Coefficient is quite close to 100%, we can say that the clustering is quite fit.
Original: https://blog.csdn.net/nixiang_888/article/details/123893331
Author: Xiaofei@IDO
Title: 确定最佳聚类的算法(一)
原创文章受到原创版权保护。转载请注明出处:https://www.johngo689.com/550780/
转载文章受原作者版权保护。转载请注明原作者出处!