

成交量(volume)是投资中一个非常重要的变量,它是指在某一时段内具体的交易数,可以在分时图中绘制,包括日线图、周线图、月线图甚至是5分钟、30分钟、60分钟图中绘制。
股市成交量的变化反映了资金进出市场的情况,成交量是判断市场走势的重要指标。总体来看,成交量大、价格上涨的个股走势向好。当成交量持续低迷时,一般出现在熊市或盘整阶段,市场并不活跃。成交量是判断股票走势的重要依据,也是分析主力行为的重要依据。投资者应密切关注成交量异常波动的个股。
[En]
The change of trading volume in the stock market reflects the situation of funds entering and leaving the market, and trading volume is an important index to judge the trend of the market. In general, stocks with large trading volume and rising prices have a positive trend. When the trading volume remains in the doldrums, it generally appears in the bear market or stock consolidation stage, and the market is not active. Trading volume is an important basis for judging the trend of stocks, and provides an important basis for analyzing the behavior of the main force. Investors should pay close attention to stocks with abnormal fluctuations in trading volume.
OBV(On-Balance Volume,净额成交量或叫能量潮指标)是最简单的股价指标之一,它可以由当日收盘价、前一天的收盘价以及当日成交量计算得出。以前一日为基期计算当日的OBV值(可以认为基期的OBV值为0)。若当日收盘价高于前一日收盘价,则本日OBV等于基期OBV加上日成交量。若当日收盘价低于前一日收盘价,则本日OBV等于基期OBV减去当日成交量。若当日收盘价相比前一日没有变化,则当日成交量以0计算。
一、OBV计算
鉴于上述计算方法,需要在成交量前面乘上一个由收盘价变化决定的正负号(收盘价低于前一交易日收盘价,负号,收盘价高于前一交易日收盘价,正号)。在本篇中,学习该问题的两种解决方法,一种是使用NumPy中的 sign 函数,另一种是使用NumPy的piecewise 函数。
1) 把数据分别加载到收盘价和成交量的数组中:
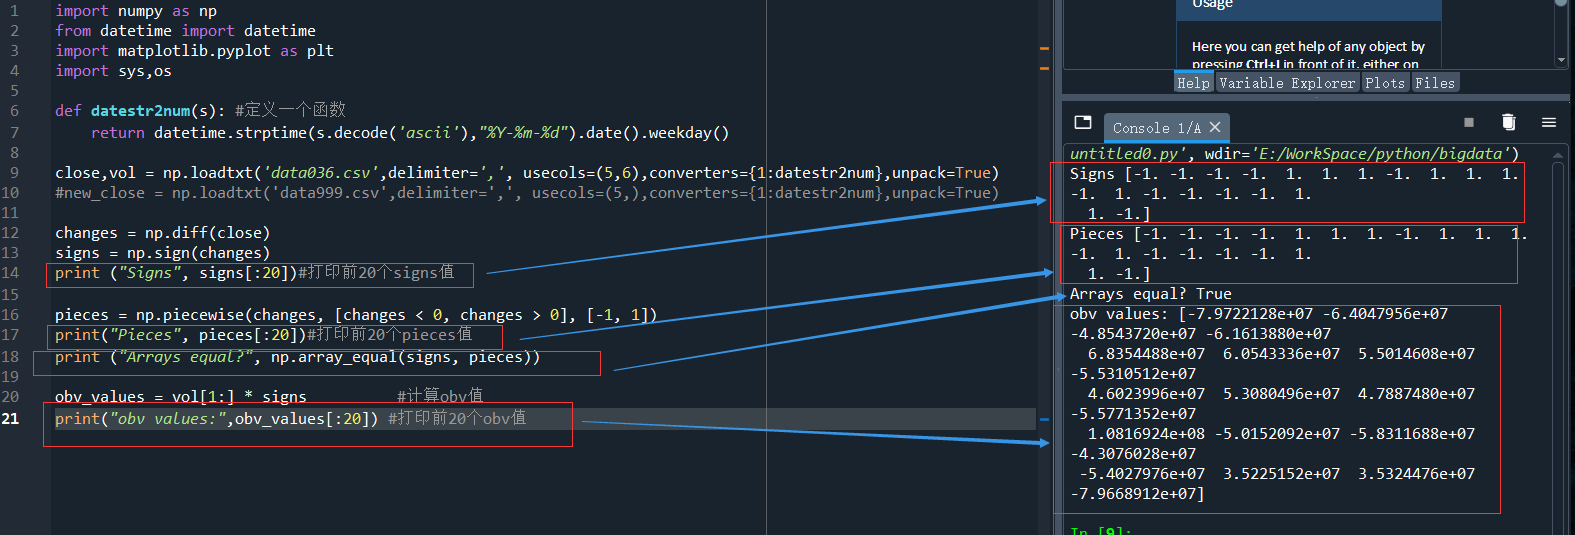
close,vol = np.loadtxt('data036.csv',delimiter=',', usecols=(5,6),converters={1:datestr2num},unpack=True)
data036.csv中的第6列和第7列分别为收盘价和当日成交量。
前篇介绍过numpy.diff()可以计算相邻的差(即上述收盘价close的差值),并利用这个差值, 用sign 函数计算正负号
changes = np.diff(close)
signs = np.sign(changes)
print ("Signs", signs)
运行结果:
Signs [-1. -1. -1. -1.  1.  1.  1. -1.  1.  1.  1. -1.  1. -1. -1. -1. -1.  1.

  1. -1. -1.  1.  1.  1.  1.  1.  1.  1. -1.  1.  1.  1. -1. -1. -1.  1.

 -1.  1.  1.  1. -1. -1.  1.  1.  1. -1. -1.  1.  1.  1.  1.  1.  1. -1....
2)也可以使用 piecewise 函数来获取数组元素的正负。 piecewise函数可以分段给定取值。使用合适的返回值和对应的条件调用该函数:
pieces = np.piecewise(changes, [changes < 0, changes > 0], [-1, 1])
print("Pieces", pieces)
3)判断是否 sign 函数和piecewise 函数计算结果是否一致用array_equal()函数:
print ("Arrays equal?", np.array_equal(signs, pieces))
运行结果:
Arrays equal? True
4)由于diff()y计算的结果是相邻数据相减,因此得到419个数据,较从文件中导入的数据420个少一位,因此无法计算首日的OBV值
obv_values = vol[1:] * signs          #计算obv值
print("obv values:",obv_values[:20]) #打印前20个obv值
完成代码如下:
import numpy as np
from datetime import datetime
import matplotlib.pyplot as plt
import sys,os

def datestr2num(s): #定义一个函数
    return datetime.strptime(s.decode('ascii'),"%Y-%m-%d").date().weekday()

close,vol = np.loadtxt('data036.csv',delimiter=',', usecols=(5,6),converters={1:datestr2num},unpack=True)
#new_close = np.loadtxt('data999.csv',delimiter=',', usecols=(5,),converters={1:datestr2num},unpack=True)

changes = np.diff(close)
signs = np.sign(changes)
print ("Signs", signs[:20])#打印前20个signs值

pieces = np.piecewise(changes, [changes < 0, changes > 0], [-1, 1])
print("Pieces", pieces[:20])#打印前20个pieces值
print ("Arrays equal?", np.array_equal(signs, pieces))

obv_values = vol[1:] * signs          #计算obv值
print("obv values:",obv_values[:20]) #打印前20个obv值
运行结果:

二、 计算单个交易日的利润
1)读入数据
加载所有交易数据(开盘价、收盘价、最高价、最低价、成交量等)放入相应的数组中
[En]
Load all transaction data (opening price, closing price, highest price, lowest price, trading volume, etc.) into the corresponding array
import numpy as np
from datetime import datetime
import matplotlib.pyplot as plt
import sys,os
def datestr2num(s): #定义一个函数
return datetime.strptime(s.decode('ascii'),"%Y-%m-%d").date().weekday()
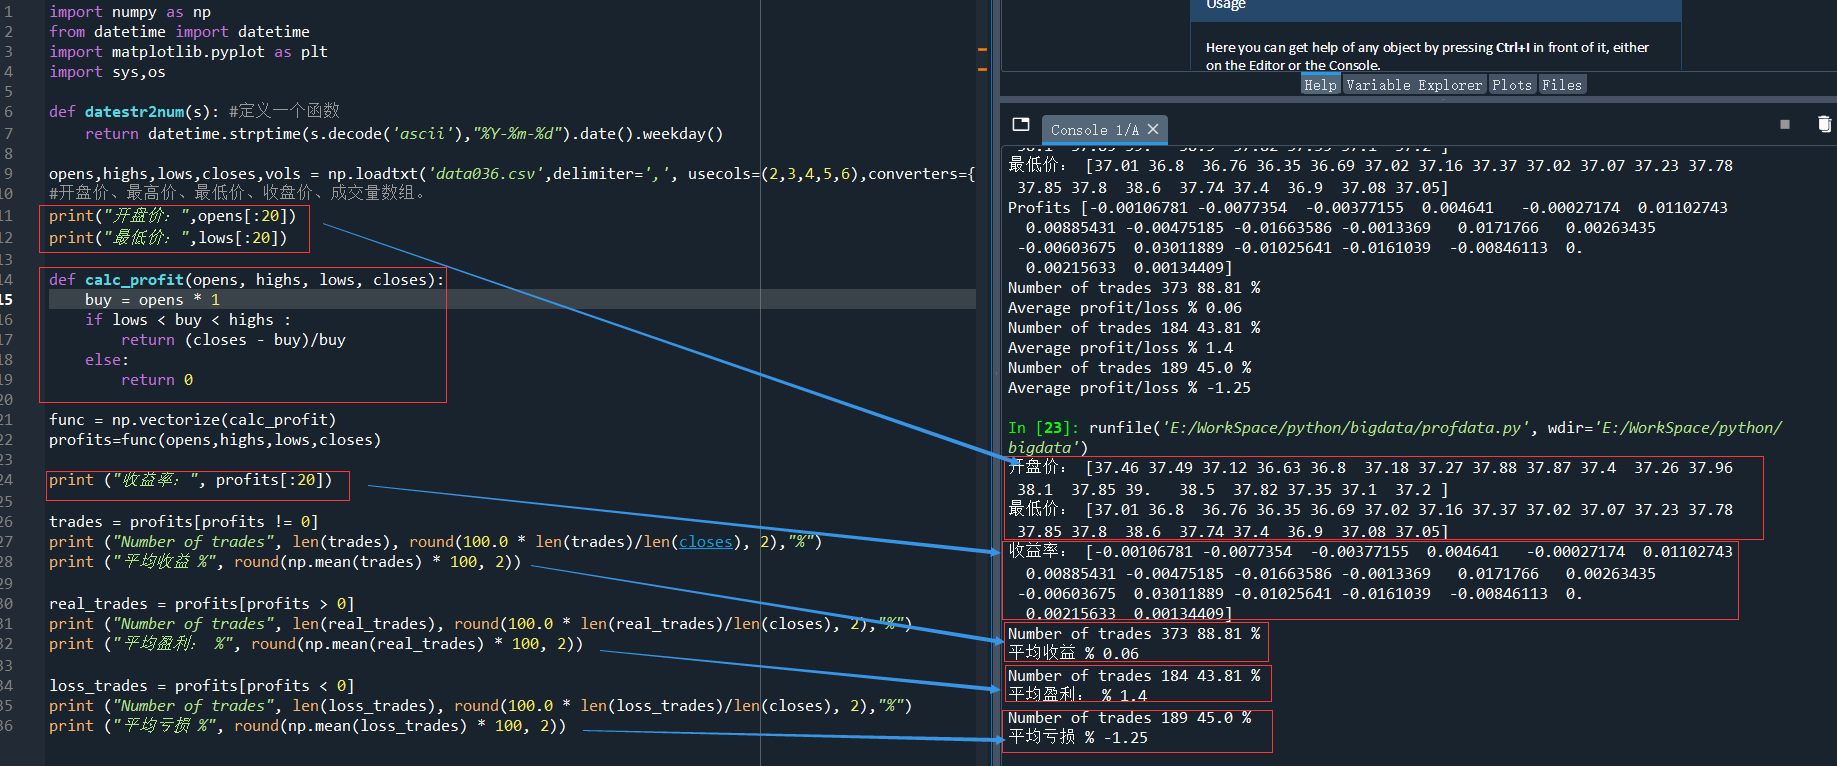
opens,highs,lows,closes,vols = np.loadtxt('data036.csv',delimiter=',', usecols=(2,3,4,5,6),converters={1:datestr2num},unpack=True) #开盘价、最高价、最低价、收盘价、成交量数组。
2)调用 vectorize 函数并给定calc_profit 函数作为参数:
(1)先定义一个计算利润的函数:这个函数,是以开盘价买入,以当日收盘价卖出,所获得的利润即买入和卖出的差价。事实上,计算相对利润更为直观。
def calc_profit(opens, highs, lows, closes):
    buy = opens * 1
    if lows < buy < highs :
        return (closes - buy)/buy
    else:
        return 0
(2)调用 vectorize 函数并给定calc_profit 函数作为参数
func = np.vectorize(calc_profit)
profits=func(opens,highs,lows,closes)

print ("Profits", profits)
3)选择非零利润的交易日,并计算平均值:
real_trades = profits[profits != 0]
print ("Number of trades", len(real_trades), round(100.0 * len(real_trades)/len(closes), 2),"%")
print ("Average profit/loss %", round(np.mean(real_trades) * 100, 2))
当然,损益也可以分开计算:
[En]
Of course, profits and losses can also be calculated separately:
real_trades = profits[profits > 0]
print ("Number of trades", len(real_trades), round(100.0 * len(real_trades)/len(closes), 2),"%")
print ("平均盈利: %", round(np.mean(real_trades) * 100, 2))

loss_trades = profits[profits < 0]
print ("Number of trades", len(loss_trades), round(100.0 * len(loss_trades)/len(closes), 2),"%")
print ("平均亏损 %", round(np.mean(loss_trades) * 100, 2))
实际运行结果:
三、数据平滑
噪声数据很难处理,因此需要对其进行平滑处理,除前篇介绍的计算移动平均线的方法,还可以使用NumPy中的一个函数来平滑数据。hanning 函数是一个加权余弦的窗函数。
1)调用 hanning 函数计算权重,生成一个长度为 N 的窗口(在这个示例中 N 取8)
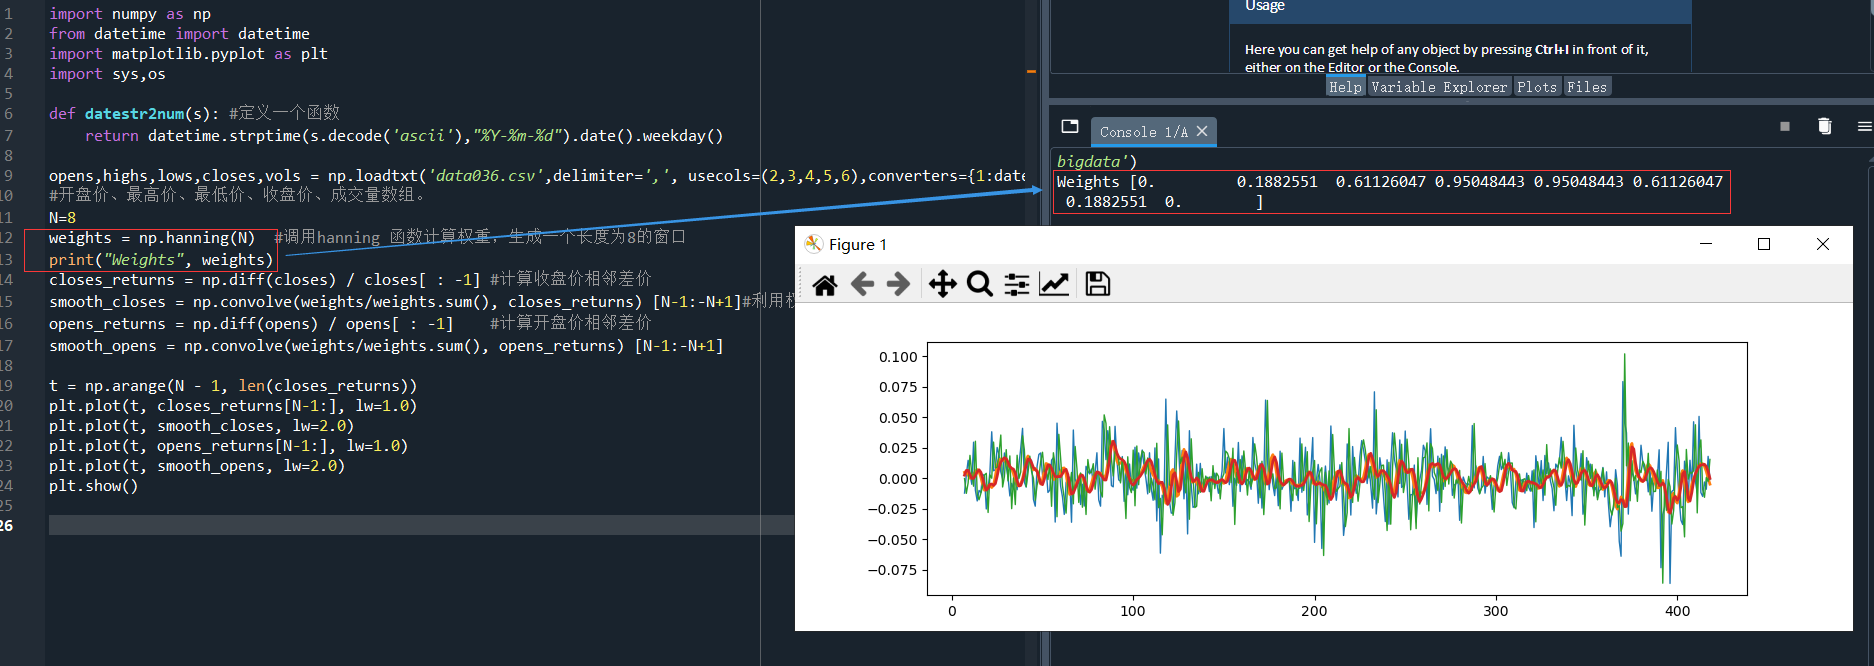
N=8
weights = np.hanning(N)  #调用hanning 函数计算权重,生成一个长度为8的窗口
print("Weights", weights)
运行结果:
Weights [0. 0.1882551 0.61126047 0.95048443 0.95048443 0.61126047 0.1882551 0. ]
2)用 convolve 函数计算closes的股票收益率,以归一化处理后的 weights 作为参数
closes_returns = np.diff(closes) / closes[ : -1] #计算收盘价相邻差价
smooth_closes = np.convolve(weights/weights.sum(), closes_returns) [N-1:-N+1]#利用权重,计算数据平滑
opens_returns = np.diff(opens) / opens[ : -1] #计算开盘价相邻差价
smooth_opens = np.convolve(weights/weights.sum(), opens_returns) [N-1:-N+1]
3)用 Matplotlib 绘图
t = np.arange(N – 1, len(closes_returns))
plt.plot(t, closes_returns[N-1:], lw=1.0)
plt.plot(t, smooth_closes, lw=2.0)
plt.plot(t, opens_returns[N-1:], lw=1.0)
plt.plot(t, smooth_opens, lw=2.0)
plt.show()
运行结果:
4)
如上图中的折线有交叉,这些交叉点可能就是股价趋势的转折点,至少可以表明closes和opens之间的股价关系发生了变化,这些转折点可能会经常出现,可以利用它们预测未来的股价走势。
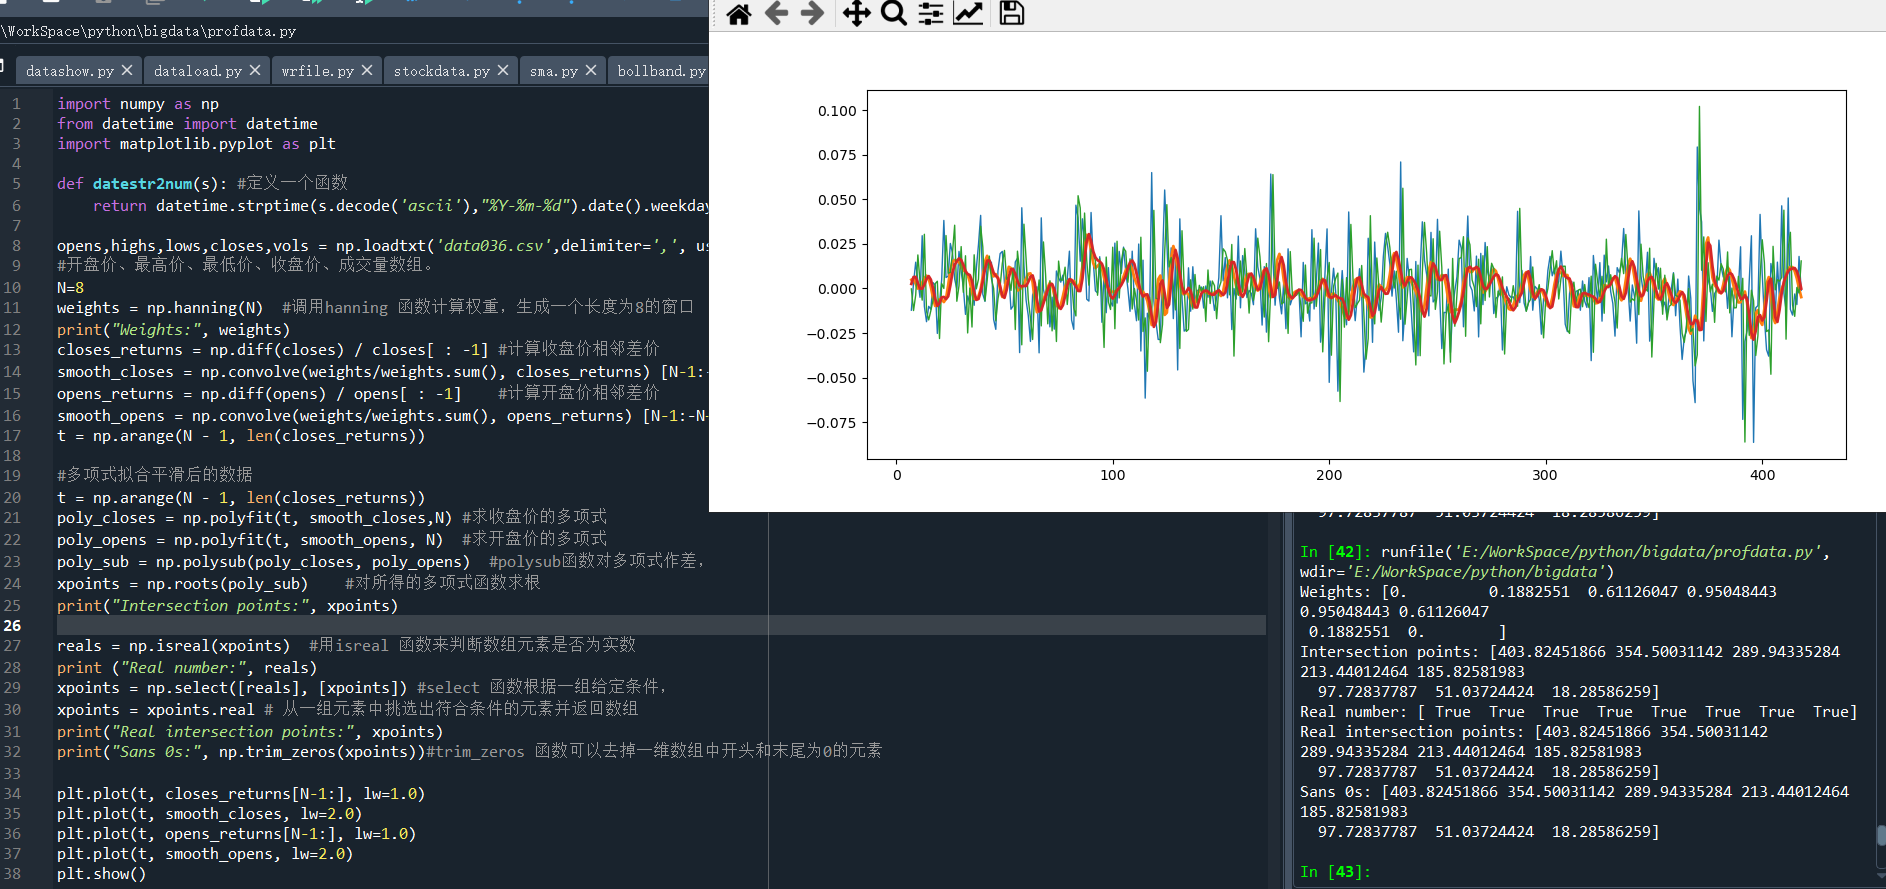
使用多项式拟合平滑后两组数据,解出的两个多项式取值相等时(即在哪些地方存在交叉点),这等价于先对两个多项式函数作差,然后对所得的多项式函数求根。使用 polysub 函数对多项式作差如下:
t = np.arange(N - 1, len(closes_returns))
poly_closes = np.polyfit(t, smooth_closes,N) #求收盘价的多项式
poly_opens = np.polyfit(t, smooth_opens, N)  #求收盘价的多项式
poly_sub = np.polysub(poly_closes, poly_opens)  #polysub函数对多项式作差,
xpoints = np.roots(poly_sub)    #对所得的多项式函数求根
print("Intersection points:", xpoints)
运行结果:
Intersection points: [403.82451866 354.50031142 289.94335284 213.44012464 185.82581983
  97.72837787  51.03724424  18.28586259]
5)用 isreal 函数来判断数组元素是否为实数,用 select 函数选出它们。 select 函数可根据一组给定的条件,从一组元素中挑选出符合条件的元素并返回数组。
得到的实数交叉点、再去掉其中为0的元素。 trim_zeros 函数可以去掉一维数组中开头和末尾为0的元素。
reals = np.isreal(xpoints)  #用isreal 函数来判断数组元素是否为实数
print ("Real number:", reals)

xpoints = np.select([reals], [xpoints]) #select 函数根据一组给定条件,
xpoints = xpoints.real # 从一组元素中挑选出符合条件的元素并返回数组
print("Real intersection points:", xpoints)
print("Sans 0s:", np.trim_zeros(xpoints))#trim_zeros 函数可以去掉一维数组中开头和末尾为0的元素
运行结果如下:
Intersection points: [403.82451866 354.50031142 289.94335284 213.44012464 185.82581983
  97.72837787  51.03724424  18.28586259]
Real number: [ True  True  True  True  True  True  True  True]
Real intersection points: [403.82451866 354.50031142 289.94335284 213.44012464 185.82581983
  97.72837787  51.03724424  18.28586259]
Sans 0s: [403.82451866 354.50031142 289.94335284 213.44012464 185.82581983
  97.72837787  51.03724424  18.28586259]
完整代码如下:
import numpy as np
from datetime import datetime
import matplotlib.pyplot as plt

def datestr2num(s): #定义一个函数
    return datetime.strptime(s.decode('ascii'),"%Y-%m-%d").date().weekday()

opens,highs,lows,closes,vols = np.loadtxt('data036.csv',delimiter=',', usecols=(2,3,4,5,6),converters={1:datestr2num},unpack=True)
#开盘价、最高价、最低价、收盘价、成交量数组。
N=8
weights = np.hanning(N)  #调用hanning 函数计算权重,生成一个长度为8的窗口
print("Weights:", weights)
closes_returns = np.diff(closes) / closes[ : -1] #计算收盘价相邻差价
smooth_closes = np.convolve(weights/weights.sum(), closes_returns) [N-1:-N+1]#利用权重,计算数据平滑
opens_returns = np.diff(opens) / opens[ : -1]    #计算开盘价相邻差价
smooth_opens = np.convolve(weights/weights.sum(), opens_returns) [N-1:-N+1]
t = np.arange(N - 1, len(closes_returns))

#多项式拟合平滑后的数据
t = np.arange(N - 1, len(closes_returns))
poly_closes = np.polyfit(t, smooth_closes,N) #求收盘价的多项式
poly_opens = np.polyfit(t, smooth_opens, N)  #求收盘价的多项式
poly_sub = np.polysub(poly_closes, poly_opens)  #polysub函数对多项式作差,
xpoints = np.roots(poly_sub)    #对所得的多项式函数求根
print("Intersection points:", xpoints)

reals = np.isreal(xpoints)  #用isreal 函数来判断数组元素是否为实数
print ("Real number:", reals)
xpoints = np.select([reals], [xpoints]) #select 函数根据一组给定条件,
xpoints = xpoints.real # 从一组元素中挑选出符合条件的元素并返回数组
print("Real intersection points:", xpoints)
print("Sans 0s:", np.trim_zeros(xpoints))#trim_zeros 函数可以去掉一维数组中开头和末尾为0的元素

plt.plot(t, closes_returns[N-1:], lw=1.0)
plt.plot(t, smooth_closes, lw=2.0)
plt.plot(t, opens_returns[N-1:], lw=1.0)
plt.plot(t, smooth_opens, lw=2.0)
plt.show()
Original: https://www.cnblogs.com/codingchen/p/16350679.html
Author: PursuitingPeak
Title: Python数据分析–Numpy常用函数介绍(6)–Numpy中与股票成交量有关的计算
原创文章受到原创版权保护。转载请注明出处:https://www.johngo689.com/499435/
转载文章受原作者版权保护。转载请注明原作者出处!