

之前有写过一篇”双色球数据爬取及写入数据库Sqlite、json和Excel表”,是通过网站提供的json网页把数据爬取并存储下来,今天就通过这个数据进行数据分析和可视化的练习。
首先我们先确定好我们的任务:
1.通过网站获取双色球最近100期的json数据并存储。
2.将json数据转为python的数据结构。
3.分析出100期双色球号码的概率。
4.将分析结果可视化,通过图标直观展示。
5.根据概率产生新的号码。
6.扩展功能:我们通过建立循环选择我们想要操作的步骤,而不是同时操作写入和展示。
为了完成以上任务我们需要代码执行以下操作:
1.通过requests获取数据,并通过json,sqlite3,xlwt模块进行数据存储(对上次写的文章的代码进行重构)
2.json.loads()将json数据转换为python数据结构
3.通过字典计算出号码概率
4.通过Matplotlib(折线图), Plotly(交互直方图)模块将数据可视化。
5.通过random.choices方法根据概率产生号码。
确定好了我们要做的任务及操作,就开始进行代码编写了,首先对之前的那篇文章代码进行重构,我们建一个Ssq_Data.py文件,导入所需的模块:
import requests,json,sqlite3,xlwt
我们先建立一个函数,用来获取双色球数据:
def get_information():
通过上篇文章我们知道网站提供了JSON格式的数据,可以直接申请获取100期的数据,然后通过json.loads将数据转换,所以我们这个函数如下:
def get_information():
    """Download the JSON data form url."""

    url = 'http://www.cwl.gov.cn/cwl_admin/front/cwlkj/search/kjxx/findDrawNotice?name=ssq&issueCount=100'
    response = requests.get(url)
    response.raise_for_status()
    data = json.loads(response.text).get('result')
    return data
(我的注释是用的英文,英文不太好有点中式,大家凑活看)
现在我们把这个函数写入json,sqlite3,xlwt文件中的代码进行重构,这里我们只展示写入json文件,其他两个大家自己发挥,所以我们先建立一个函数:
def json_data(json_data)():
    """Generate the json file according to the nearly 100 issues."""

    json_data = get_information()
    days = datetime.datetime.fromtimestamp(time.time()).strftime('(%Y%m%d)')
    with open('./datafiles/Ssq_data' + days +'.json', 'w',encoding='utf-8') as json_file:
        json.dump(json_data, json_file, indent=4, ensure_ascii=False)
    print("Data saved successfully")
解释下,通过datetime和time模块获取当前时间,导入模块:
import requests,json,sqlite3,xlwt,time,datetime
我们只需要年月日,所以通过.strftime(‘(%Y%m%d)’转为日期,我们把这个日期添加到我们的文件命中,这样避免覆盖旧文件,以后可以把双色球的数据都累计起来。最后添加个print,成功后添加打印行。
同样的sqlite3,xlwt建立连个函数,命名方式也采取同样的方法,内容就不展示了,方法之前文章里有:
def sqlite_data(json_data):..

def xls_data(json_data):...
接下来,我们对这100期数据进行统计,得出每个号码出现的概率,函数如下:
def probability_data(json_data):
    """Count the probability of each number appearing."""

    json_data = get_information()
    red_num_frequency = {}
    blue_num_frequency = {}
    for entry in json_data:
        for number in entry['red'].split(","):
            red_num_frequency[number] = red_num_frequency.get(number,0) +1
        blue_num_frequency[entry['blue']] = blue_num_frequency.get(entry['blue'],0) + 1
    return red_num_frequency,blue_num_frequency
逐个分析下,首先建立两个字典分别为红号和蓝号,然后遍历我们的json_data,然后循环中再遍历每期的红号,每个号出现一次加1次,这样统计出来每个号出现的次数,同理蓝号也统计每个号的次数,最后返回两个字典,我们打印会出来如下结果:


每个号码出现的次数被我们统计出来了,但是我们也发现了并没有顺序排列,有点乱,虽然不影响我们用这个概率选号,但是会影响我们做图,所以我们重新对字典进行排序,函数如下:
def sorted_dict(dicnary):
    """Rearrange the DICT according to the key."""

    sorted_dict = {}
    for i in sorted(dicnary):
        sorted_dict[i] = dicnary[i]
    return sorted_dict
sorted(dicnary)会对字典的key进行排列,我们这样得到了重新排列的key,然后把key所属的值再重新赋予与它,这样就得到了重新排列的字典。
再下面就到了把我们把分析的数据可视化,进行直观的分析,这里我们做两个图,第一个我们通过Matplotlib模块作出折线图,所以导入模块并指定别名:
import matplotlib.pyplot as plt
然后建立函数,内容如下:
def lineChart(data):
    """Generated the line chart according to the recent 100 issues's probability."""

    data = probability_data(data)
    redx_lst = [1,2,3,4,5,6,7,8,9,10,11,12,13,14,15,16,17,18,19,20,21,22,23,24,25,26,27,28,29,30,31,32,33]
    red_data = sorted_dict(data[0])
    redy_lst = list(red_data.values())
    bluex_lst = [1,2,3,4,5,6,7,8,9,10,11,12,13,14,15,16]
    blue_data = sorted_dict(data[1])
    bluey_lst = list(blue_data.values())
    fig,d_image = plt.subplots()

    fig.set_size_inches(12, 8)
    d_image.plot(redx_lst,redy_lst,"r-.o",c = '#CC3333',linestyle='-',label='red_number')
    d_image.plot(bluex_lst,bluey_lst,"r-.o",c = '#0099CC',linestyle='-',label='blue_number')

    d_image.set_title('Count the times of each number appearing in recent 100 issues')
    d_image.set_xlabel('Ball_number')
    d_image.set_ylabel('Times of the number appears')
    days = datetime.datetime.fromtimestamp(time.time()).strftime('(%Y%m%d)')

    x_tick_label = range(35)
    plt.xticks(x_tick_label)

    plt.grid(True,linestyle = '--',alpha=0.3)
    plt.legend(loc='lower right', fontsize=10)
    plt.savefig('./datafiles/doublex_color' + days + '.jpg')
    plt.show()
首先获取分析的数据,然后我们建立列表redx_list,里面存储x轴的数据,然后我们通过重新排列后的字典获取y轴数据(号码出现的次数)并将其赋予redy_list,同理把蓝号的数据同样建立bluex_lst和bluey_lst两个轴,建立好数据之后我们调用函数subplots()函数,此函数可以在一张图片中绘制一个或者多个图表,变量fig表示整张图片,d_image表示各个图表。set_size_inches是调整图片的尺寸,因为x轴刻度较多所以我们把尺寸调大点。接下来调用方法plot()绘制图表(scatter是散点图),我们需要两个线一个表示红号,一个表示蓝号,所以调用两次,再说说里面的参数,前两个分别为x和y轴数据,”r-.o”表示折点的形式,c = ‘#0099CC’线的颜色,linestyle表示线的形式,label指定折线的名字。d_image.set_title,d_image.set_xlabel和d_image.set_ylabel分别指定图表的标题,x轴和y轴的标题。xticks()函数重新指定x轴刻度,此处我们每个数做一个刻度直到35。grid()方法是显示背景网格。legend()指定图例即折线的名字显示位置及字体。我们同时将作出的图片保存下来,名字同样采用名字+日期的命名方式。最后通过show()函数打开Matplotlib查看器并显示绘制的图表,在查看器中可以调整图表和保存图表。我们图表显示如下:
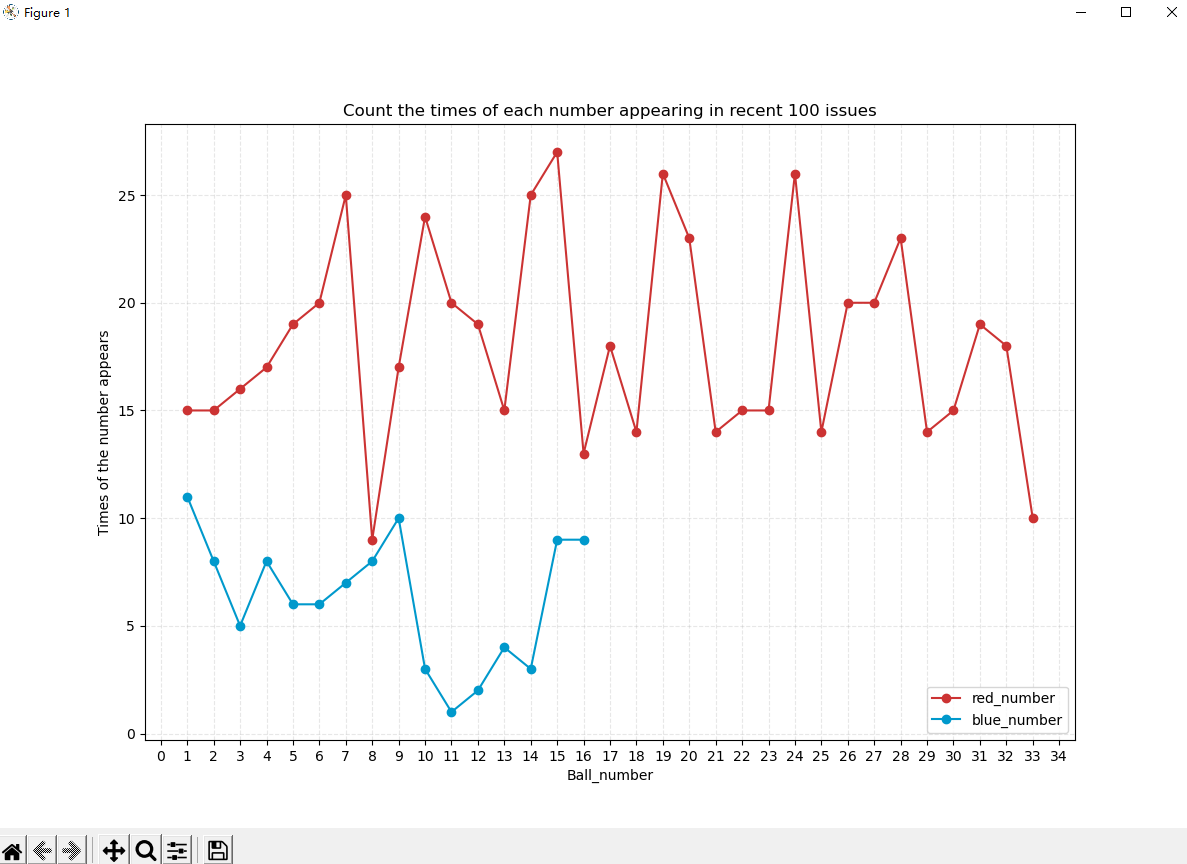
这个图表也比较直观的看出每个号码出现的次数。
第二张图片我们通过Plotly模块创建一个交互式的直方图,鼠标放在每个直方时可以显示出相关信息,首先我们导入Plotly模块:
from plotly.graph_objs import Bar, Layout
from plotly import offline
创建函数:
def Histogram(data):
    """Generated the histogram according to the recent 100 issues's probability."""
    data = probability_data(data)
    redx_lst = [1,2,3,4,5,6,7,8,9,10,11,12,13,14,15,16,17,18,19,20,21,22,23,24,25,26,27,28,29,30,31,32,33]
    red_data = sorted_dict(data[0])
    redy_lst = list(red_data.values())
    blue_data = sorted_dict(data[1])
    bluey_lst = list(blue_data.values())
    days = datetime.datetime.fromtimestamp(time.time()).strftime('(%Y%m%d)')

    data1 = [Bar(x=redx_lst,y=redy_lst,name = "red_number",marker_color="#CC3333"),
            Bar(x=redx_lst,y=bluey_lst,name = "blue_number",marker_color="#4D96FF")]

    x_axis_config = {'title':'Ball_number'}
    y_axis_config = {'title':'Times of the number appears'}
    my_layout = Layout(title = 'Count the times of each number appearing in recent 100 issues' ,
                xaxis = x_axis_config,yaxis = y_axis_config)

    offline.plot({'data':data1,'layout':my_layout},
            filename = './datafiles/doubleColor' + days + '.html')
同样,我们给与x轴和y轴数据,y轴分别给与红号和蓝号的数据,通过Bar()类存储绘制直方图的数据集,同时里面可以把数据的名字和颜色设置好,再通过Layout()返回一个指定的图标布局和配置对象,比如x和y轴的标签,图表的标题,最后调用offline.plot()函数,通过一个包含数据和布局对象的字典,然后保存一个html的文件到指定的文件夹,文件名字同样的命名方式。我们最后生成的图像如下图:
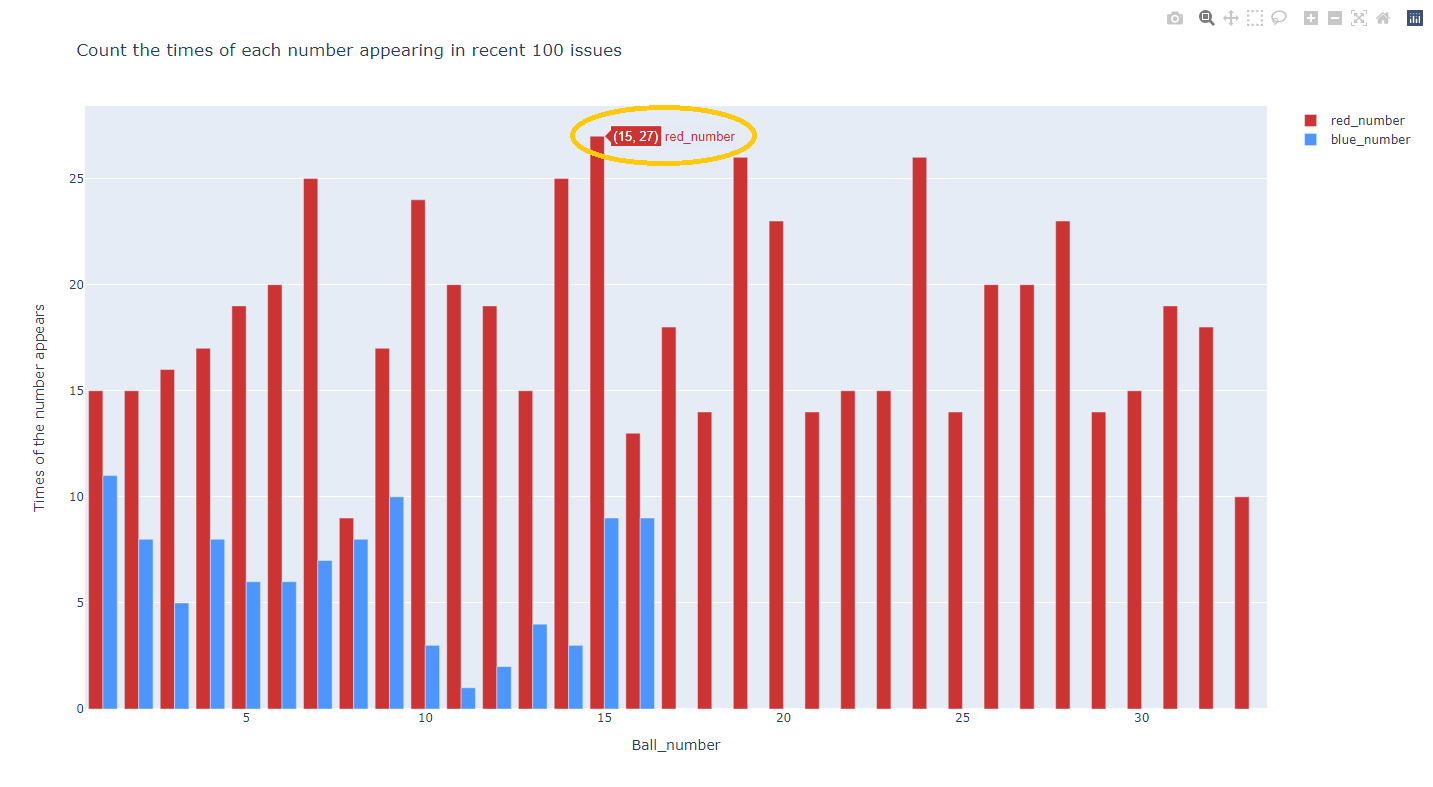
这个会在浏览器打开我们的图表,当我们的鼠标放在直方上时会显示出相关的数据(黄色圈起部分)。
最后一个功能是我们根据每个数出现的概率随机产生新的号码,分别建立两个函数产生红号和蓝号,最后再建立一个函数汇总红号和蓝号,同时我们希望可以生成一个或多个双色球号码所以需要一个循环并可以输入想要的号码个数,三个函数如下:
def red_ball(data):
    """Randomly generated the red_number according to the recent 100 issues's probability."""

    data = probability_data(data)
    red = set()
    red_list = [1,2,3,4,5,6,7,8,9,10,11,12,13,14,15,16,17,18,19,20,21,22,23,24,25,26,27,28,29,30,31,32,33]
    rw = data[0]
    while len(red) < 6 :
        red.add(random.choices(red_list, weights=(rw["01"], rw["02"], rw["03"] , rw["04"], rw["05"], rw["06"]
        ,rw["07"],rw["08"],rw["09"],rw["10"],rw["11"],rw["12"],rw["13"],rw["14"],rw["15"],rw["16"],rw["17"]
        ,rw["18"],rw["19"],rw["20"],rw["21"],rw["22"],rw["23"],rw["24"],rw["25"],rw["26"],rw["27"]
        ,rw["28"],rw["29"],rw["30"],rw["31"],rw["32"],rw["33"]), k=1)[0])
    redballs = [str(x) for x in sorted(red)]
    return redballs

def blue_ball(data):
    """Randomly generated the blue_number according to the recent 100 issues's probability."""

    rw = data[1]
    blue_list = [1,2,3,4,5,6,7,8,9,10,11,12,13,14,15,16]
    blueball = random.choices(blue_list, weights=(rw["01"], rw["02"], rw["03"] , rw["04"], rw["05"], rw["06"]
        ,rw["07"],rw["08"],rw["09"],rw["10"],rw["11"],rw["12"],rw["13"],rw["14"],rw["15"],rw["16"]
        ), k=1)[0]
    return blueball

def double_ball_number(red,blue):
    """Combine the red_numbers and the blue_numbers."""

    numbers = int(input("Please eter your number that hou many you want: "))
    for i in range(numbers):
        return "\nRed: {} Blue: {}\n".format(",".join(red),blue)
我们逐个解释下,红号部分,因为不能有重复的所以我们使用到了集合,同时我们需要建立一个红号数集共33个,然后建立一个while循环来使集合生成6个数,在循环中通过random.choices,分别赋予红号数集中的每个数100期内出现的概率即次数,这样每个号码被赋予了不同的权重(概率),每次选出一个并添加到集合,直到生成六个数,最后通过列表解析和sorted方法从小到大重新排列六个数。蓝号同样的方法就不再赘述,最后通过double_ball_number(red,blue)将两个号码汇集。
最后的最后我们需要建立一个执行函数,这个函数是一个while循环,如下图:
def run_program():
    """Establish a while loop, you can select conditions multiple times to query"""
    while True:
        print("\nPlease select the number of the data that you need: \n\
        1.Generate json file according to the nearly 100 issues\n\
        2.Generate sqlite file according to thenearly 100 issues\n\
        3.Generate xls file according to the nearly 100 issues\n\
        4.Generate lineChart as jpg according to the nearly 100 issues\n\
        5.Generate Histogram as html according to the nearly 100 issues \n\
        6.Generate the new number according to the recent 100 issues's probability")
        select_number = input("\nYour selcet number(Enter q to quit):  ")
        if select_number == "1":
            json_data(data)
        elif select_number == "2":
            sqlite_data(data)
        elif select_number == "3":
            xls_data(data)
        elif select_number == "4":
            lineChart(pro_data)
        elif select_number == "5":
            Histogram(pro_data)
        elif select_number == "6":
            print(double_ball_number(red_ball(pro_data),blue_ball(pro_data)))
        elif select_number == "q":
            break
        else:
            print("\nPlease enter the right number")
这个运行函数首先打印出我们可以做的选择,如是要存储数据,存储成什么数据,还是要生成可视化,用哪种方式可视化,还是要根据概率生成号码等等,然后通过条件语句选择执行。
最后运行代码:
if __name__ == "__main__":
    try:
        run_program()
    except Exception as e:
        print("ERROR: " + str(e))
写完之后对代码进行优化,我们看一遍每个函数会发现里面有几个地方是有重复的,而且会出现重复调用函数如probability_data(data)和 get_information(),我们将多次在函数内调用的函数放到run函数中,这样无需重复执行了,同时获得日期的time函数同样可以放在run函数中,通过参数传递给各个函数,这样我们run函数变成如下:
def run_program():
    """Establish a while loop, you can select conditions multiple times to query"""
    data = get_information()
    pro_data = probability_data(data)
    days = datetime.datetime.fromtimestamp(time.time()).strftime('(%Y%m%d)')
    while True:
        print("\nPlease select the number of the data that you need: \n\
        1.Generate json file according to the nearly 100 issues\n\
        2.Generate sqlite file according to thenearly 100 issues\n\
        3.Generate xls file according to the nearly 100 issues\n\
        4.Generate lineChart as jpg according to the nearly 100 issues\n\
        5.Generate Histogram as html according to the nearly 100 issues \n\
        6.Generate the new number according to the recent 100 issues's probability")
        select_number = input("\nYour selcet number(Enter q to quit):  ")
        if select_number == "1":
            json_data(data,days)
        elif select_number == "2":
            sqlite_data(data,days)
        elif select_number == "3":
            xls_data(data,days)
        elif select_number == "4":
            lineChart(pro_data,days)
        elif select_number == "5":
            Histogram(pro_data,days)
        elif select_number == "6":
            print(double_ball_number(red_ball(pro_data),blue_ball(pro_data)))
        elif select_number == "q":
            break
        else:
            print("\nPlease enter the right number")
别忘了把函数中调用函数的代码和获取时间的代码删掉,并给函数传递相关参数。到此我们的代码就完成了,当然你也可以把代码打包成exe,这里就不详说了。
也可以根据代码自己做一个双色球模拟生成器,根据自己随机产生的号码看看每个数出现的概率,比如模拟100万次看看最后每个号的概率,其实每个号出现的概率随着次数的增多会接近相等,比如100万次的结果如下图:
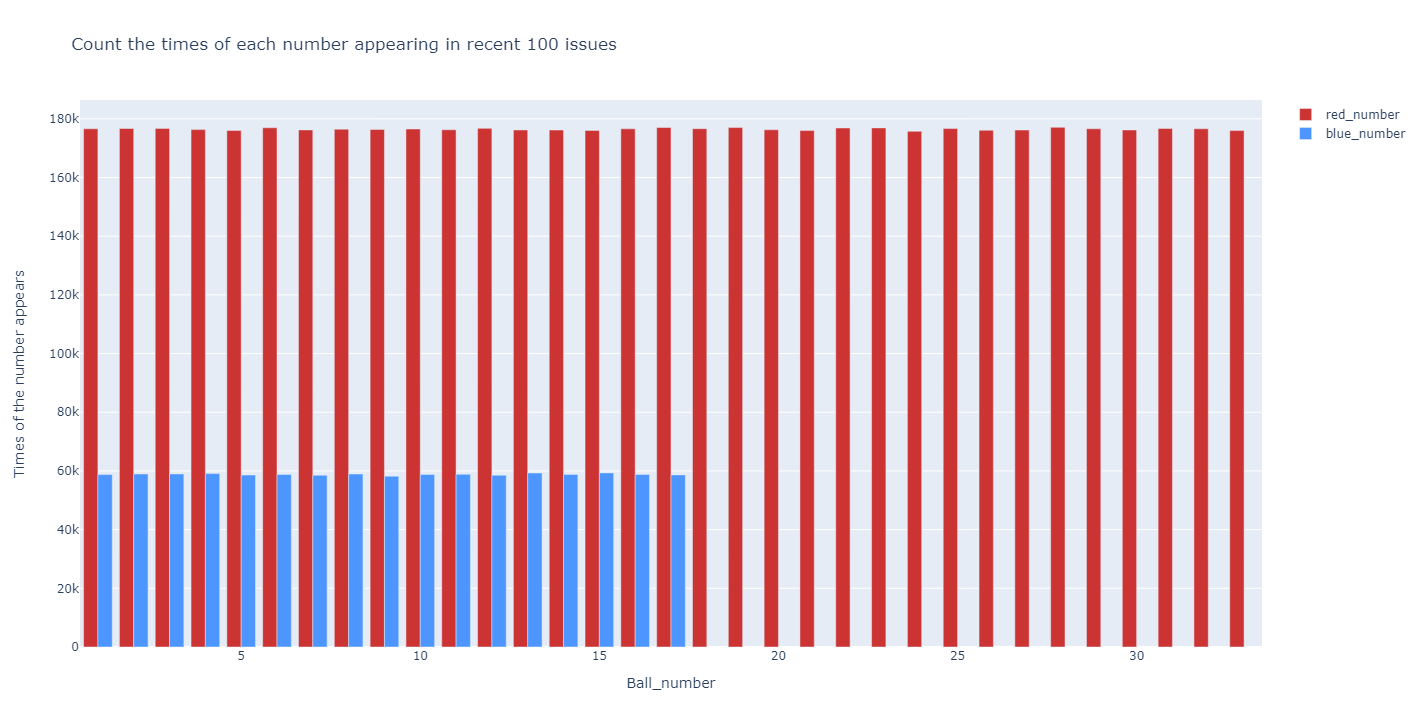
看到这个概率有什么想法,是不是过去100期里概率出现越大的号越应该避免买呢??!
最后祝大家都能中大奖!(友情提示:彩票玩的是心情,中不中奖看运气,切勿过度!)
Original: https://blog.csdn.net/weixin_54230895/article/details/123703696
Author: 曾经的你_2015
Title: Python数据分析及可视化(Matplotlib, Plotly,random)实例:双色球根据往期数据产生随机号码
原创文章受到原创版权保护。转载请注明出处:https://www.johngo689.com/815559/
转载文章受原作者版权保护。转载请注明原作者出处!