

相对于echarts等基于JavaScript的图表库,matplotlib的交互能力相对较差。
在实际应用中,我们经常想使用十字光标来定位数据坐标,matplotlib内置提供支持。
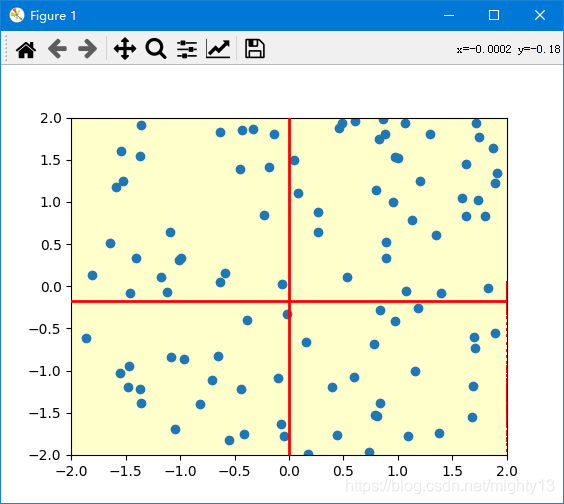
官方示例
matplotlib提供了官方示例https://matplotlib.org/gallery/widgets/cursor.html
from matplotlib.widgets import Cursor
import numpy as np
import matplotlib.pyplot as plt
Fixing random state for reproducibility
np.random.seed(19680801)
fig = plt.figure(figsize=(8, 6))
ax = fig.add_subplot(111, facecolor=’#FFFFCC’)
x, y = 4*(np.random.rand(2, 100) – .5)
ax.plot(x, y, ‘o’)
ax.set_xlim(-2, 2)
ax.set_ylim(-2, 2)
Set useblit=True on most backends for enhanced performance.
cursor = Cursor(ax, useblit=True, color=’red’, linewidth=2)
plt.show()

原理
由源码可知,实现十字光标的关键在于widgets模块中的Cursor类。
class matplotlib.widgets.Cursor(ax, horizOn=True, vertOn=True, useblit=False, **lineprops)
ax:参数类型matplotlib.axes.Axes,即需要添加十字光标的子图。
horizOn:布尔值,是否显示十字光标中的横线,默认值为显示。
vertOn:布尔值,是否显示十字光标中的竖线,默认值为显示。
useblit:布尔值,是否使用优化模式,默认值为否,优化模式需要后端支持。
**lineprops:十字光标线形属性, 参见axhline函数支持的属性,https://matplotlib.org/api/_as_gen/matplotlib.axes.Axes.axhline.html#matplotlib.axes.Axes.axhline。
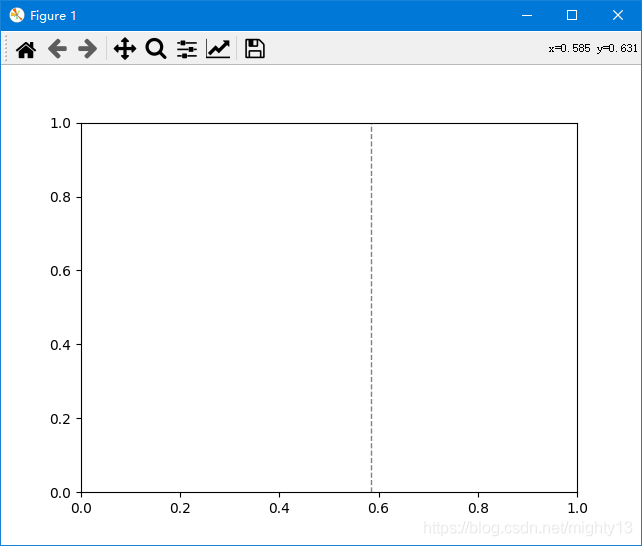
简化案例
光标改为灰色竖虚线,线宽为1。
from matplotlib.widgets import Cursor
import matplotlib.pyplot as plt
ax = plt.gca()
cursor = Cursor(ax, horizOn=False, vertOn= True, useblit=False, color=’grey’, linewidth=1,linestyle=’–‘)
plt.show()
Cursor类源码
class Cursor(AxesWidget):
“””
A crosshair cursor that spans the axes and moves with mouse cursor.
For the cursor to remain responsive you must keep a reference to it.
Parameters
**lineprops
.Line2D properties that control the appearance of the lines.
See also ~.Axes.axhline.
Examples
Original: https://blog.csdn.net/weixin_33520849/article/details/113673118
Author: NX-8MAA09148HY
Title: python画十字_matplotlib绘制鼠标的十字光标的实现(内置方式)
原创文章受到原创版权保护。转载请注明出处:https://www.johngo689.com/769589/
转载文章受原作者版权保护。转载请注明原作者出处!