

hello,大家好,我是wangzirui32,今天我们来学习如何使用selenium+matplotlib来爬取天气预报,并制作未来气温折线图。
先来看看成品:
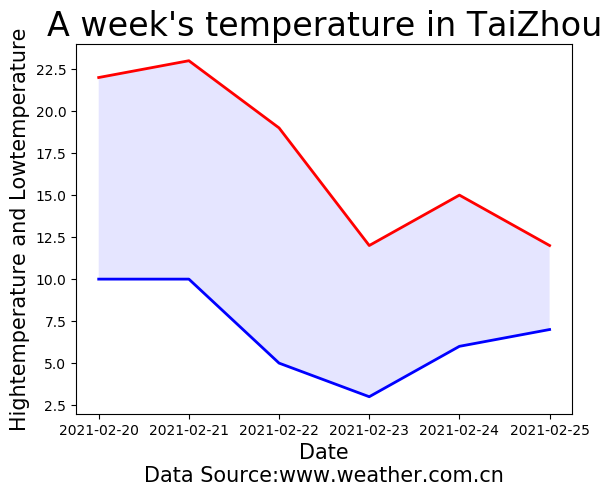

好了,看到了我们的成果,相信你会更有学习的动力的!
开始学习吧!
学习目录
; 1. 爬取天气数据并存储到json文件中
1.2 数据来源
这里使用的数据来源为中国天气网(www.weather.com.cn)所提供的天气预报。
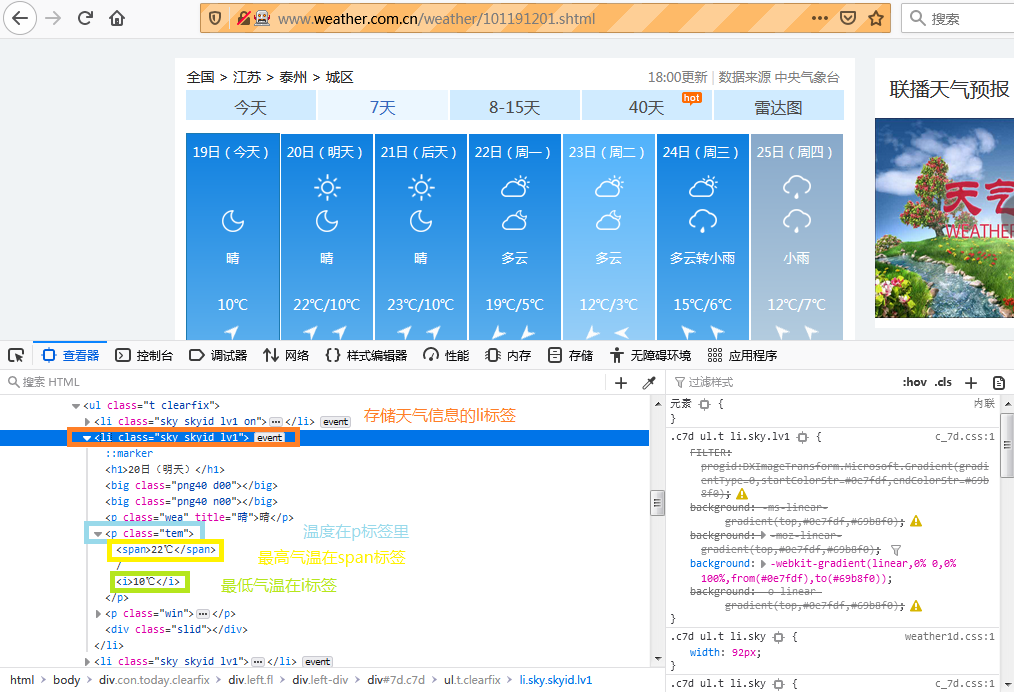
1.3 分析天气预报网页
我就以泰州市为例子,未来7天(实际我们要爬取的是未来6天,是不包含今天的天气数据)的天气预报网页为http://www.weather.com.cn/weather/101191201.shtml,可以看出,101191201是城市编号,切换城市编号就可以获取不同城市的天气预报。
开始分析:

可以看出,ul中的每一项li标签都是一天的天气数据,继续分析:
; 1.4 编写爬取代码
from selenium.webdriver import Firefox
from datetime import datetime, timedelta
from json import dump

city_id = 101191201

url = "http://www.weather.com.cn/weather/" + str(city_id) + ".shtml"

driver = Firefox(executable_path="geckodriver.exe")

driver.get(url)

ul = driver.find_element_by_xpath("//ul[@class='t clearfix']")

li_list = ul.find_elements_by_tag_name("li")

del li_list[0]

temperature_data_list = []

day = 1

for li in li_list:

    p = li.find_element_by_css_selector("p.tem")

    date = (datetime.now() + timedelta(days=day)).strftime("%Y-%m-%d")

    low_temperature = int(p.find_element_by_tag_name("i").text[:-1])
    high_temperature = int(p.find_element_by_tag_name("span").text[:-1])

    dict_temperature = {"date": date,
                        "low": low_temperature,
                        "high": high_temperature}

    temperature_data_list.append(dict_temperature)

    day += 1

with open("temperature.json", "w") as t:

    dump(temperature_data_list, t)
运行代码,即可存储天气数据。
- 读取数据并使用matplotlib制作图表
现在,我们获取加载temperature.json中的数据,用matplotlib制作图表:
import matplotlib.pyplot as plt
from json import load
from datetime import datetime

city_name = "TaiZhou"

with open("temperature.json") as t:
    data = load(t)

    date, high, low = [], [], []

    for d in data:
        date.append(datetime.strptime(d["date"], '%Y-%m-%d'))
        high.append(int(d["high"]))
        low.append(int(d["low"]))

plt.plot(date, high, c='red', linewidth=2)
plt.plot(date, low, c='blue', linewidth=2)

plt.fill_between(date, high, low, facecolor='blue', alpha=0.1)

plt.title("A week's temperature in " + city_name, fontsize=24)
plt.xlabel("Date\nData Source:www.weather.com.cn", fontsize=15)
plt.ylabel("Hightemperature and Lowtemperature", fontsize=15)

plt.tick_params(axis='both', labelsize=10)

plt.savefig("A week's temperature in " + city_name + ".png", bbox_inches='tight')

plt.show()
写在最后
这个程序你还可以有一些”逆天”的操作,比如直接爬取未来40天的温度数据,当然这里作者就不演示了,大家可以自己试一下哦!
好了,这些就是今天的内容,感兴趣的可以点赞收藏,感谢你们!
Original: https://blog.csdn.net/wangzirui32/article/details/113871177
Author: wangzirui32
Title: Python番外篇:selenium+matplotlib 爬取天气预报 制作温度折线图
原创文章受到原创版权保护。转载请注明出处:https://www.johngo689.com/769445/
转载文章受原作者版权保护。转载请注明原作者出处!