

matplotlib.pyplot.bar (x, height, width=0.8, bottom=None, *, align=’center’, data=None, _kwargs_)**
功能
此函数用来画条形图
参数
x:为条形图的横坐标,格式float or array-like
height:条形图的高,格式float or array-like
width:条形图的宽,格式loat or array-like, 默认为0.8
bottom:The y coordinate(s) of the bars bases.格式float or array-like, 默认为0
align:矩形条与x的对齐方式,默认为中心对齐,如下左图所示。如果要对齐右边的线条,如下右图所示,可以将宽度置为负数 (如width = -1)且令 align='edge'。

**kwargs:矩形的属性
_另外还有一些其他参数,如_color:设置条形的颜色。edgecolor:设置条形的边缘颜色 等,具体参见文章尾部。
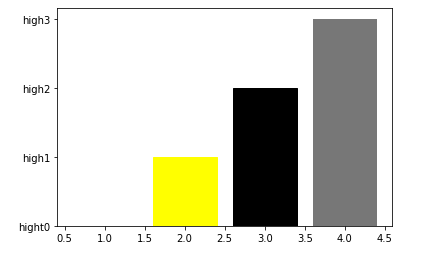
例子
names = [1,2,3,4]
values = ['hight0','high1','high2','high3']
thisplot = plt.bar(names, values,color="#777777") #设置默认灰色
#thisplot = plt.bar(names, values,width = -1,align='edge',color="#777777")  #设置bar为右对齐
thisplot[1].set_color('yellow')
thisplot[2].set_color('#000000') #黑色
plt.show()
结果
其他参数以及 矩形的属性( _kwargs)_**
Other Parameters:
linewidth:矩形条的边的宽度,0为不画边。float or array-like, optional
tick_label:矩形条的标识,默认无 。str or list of str, optional
xerr, yerrfloat or array-like of shape(N,) or shape(2, N), optional
If not None, add horizontal / vertical errorbars to the bar tips. The values are +/- sizes relative to the data:
- scalar: symmetric +/- values for all bars
- shape(N,): symmetric +/- values for each bar
-
shape(2, N): Separate – and + values for each bar. First row contains the lower errors, the second row contains the upper errors.
-
None: No errorbar. (Default)
ecolorcolor or list of color, default: ‘black’
The line color of the errorbars.
capsizefloat, default: <a href="https://matplotlib.org/stable/tutorials/introductory/customizing.html?highlight=errorbar.capsize#a-sample-matplotlibrc-file">rcParams["errorbar.capsize"]</a> (default: 0.0)
The length of the error bar caps in points.
error_kwdict, optional
Dictionary of kwargs to be passed to the errorbar method. Values of ecolor or capsize defined here take precedence over the independent kwargs.
logbool, default: False
If True, set the y-axis to be log scale.
**kwargs:矩形属性
PropertyDescriptionagg_filter
a filter function, which takes a (m, n, 3) float array and a dpi value, and returns a (m, n, 3) arrayalpha
scalar or Noneanimated
boolantialiased
or {‘butt’, ‘projecting’, ’round’}clip_box Bbox clip_on
boolclip_path
Patch or (Path, Transform) or Nonecolor
colorcontains
unknownedgecolor
or eccolor or None or ‘auto’facecolor
or fccolor or Nonefigure Figure fill
boolgid
strhatch
{‘/’, ‘\’, ‘|’, ‘-‘, ‘+’, ‘x’, ‘o’, ‘O’, ‘.’, ‘*’}in_layout
or {‘miter’, ’round’, ‘bevel’}label
objectlinestyle
or ls{‘-‘, ‘–‘, ‘-.’, ‘:’, ”, (offset, on-off-seq), …}linewidth
or lwfloat or Nonepath_effects AbstractPathEffect picker
None or bool or float or callablerasterized
boolsketch_params
(scale: float, length: float, randomness: float)snap
bool or Nonetransform Transform url
strvisible
boolzorder
float
注:
参考文献
https://matplotlib.org/stable/gallery/misc/table_demo.html#sphx-glr-gallery-misc-table-demo-py
Original: https://blog.csdn.net/Crystal_remember/article/details/116758131
Author: Alocus_
Title: matplotlib.pyplot.bar() plt.bar()
原创文章受到原创版权保护。转载请注明出处:https://www.johngo689.com/769311/
转载文章受原作者版权保护。转载请注明原作者出处!