

提示:以下matplotlib.pyplot中的函数来自官方库,下面翻译和示例仅供参考。
文章目录
关于matplotlib的pyplot包的函数集
matplotlib.pyplot is a state-based interface to matplotlib. It provides a MATLAB-like way of plotting.
matplotlib.pyplot是命令行式函数的集合,每一个函数都对图像作了修改。
一、pyplot函数集
matplotlib.pyplot是命令行式函数的集合,每一个函数都对图像作了修改【比如 创建图形, 在图像上创建画图区域, 在画图区域上画线, 在线上标注等】
get_plot_commands()
1、pyplot—创建画布、设定绘图区域、颜色系
1)创建
Figure([num,figsize,dpi,facecolor,...])
fignum_exists(num)
figlegend(* args,** kwargs)
figimage(X [,xo,yo,alpha,norm,cmap,...])

savefig(* args,** kwargs)
close([fig])
2)画图区域
new_figure_manager(num,* args,** kwargs)
matshow(A [,fignum])
margins(* margins [,x,y,ight])

subplot(* args,** kwargs)

subplot2grid(shape,loc [,rowspan,colspan,图])
subplot_mosaic(layout,* [,subplot_kw,...])
subplot_tool([targetfig])
subplots([nrows,ncols,sharex,sharey,...])
subplots_adjust([[left,bottom,right,top,...])

suptitle(t,** kwargs)
switch_backend(newbackend)
3) 颜色系
set_cmap(cmap)
clim([vmin,vmax])
autumn()
bone()
copper()
cool()
flag()
gray()
hot()
hsv()
inferno()
jet()
magma()
nipy_spectral()
pink()
plasma()
prism()
summer()
spring()
viridis()
winter()
2、pyplot– 坐标系、轴、标注
title(label [,fontdict,loc,pad,y])
table([cellText,cellColours,cellLoc,...])

xlabel( xlabel [,fontdict,labelpad,loc])
xlim( * args,** kwargs)
xscale( value,** kwargs)
xticks( [ticks,labels])

ylabel( ylabel [,fontdict,labelpad,loc])
ylim( * args,** kwargs)
yscale( value,** kwargs)
yticks( [ticks,labels])

annotate(text, xy, *args, **kwargs)
figtext(x,y,s [,fontdict])
text(x,y,s [,fontdict])

axes([arg])
axhline([y,xmin,xmax])
axvline([x,ymin,ymax])
axline(xy1 [,xy2,slope])

clabel(CS [,level])

axhspan(ymin,ymax [,xmin,xmax])
axvspan(xmin,xmax [,ymin,ymax])

axis(* args [,emit])

cla()
gca(** kwargs)
delaxes([ax])
arrow(x, y, dx, dy, **kwargs)
autoscale([enable, axis, tight])
legend(* args,** kwargs)
locator_params([axis,ight])

minorticks_off()
minorticks_on()

semilogx(* args,** kwargs)
semilogy(* args,** kwargs)

thetagrids([angles,labels,fmt])
tick_params([axis])
ticklabel_format(* [,axis,style,...])

twinx([ax])
twiny([ax])

sca(ax)
3、pyplot–在画图区域绘图、展示、保存
1)绘线
plot(* args [,scalex,scaley,data])
plot_date(x,y [,fmt,tz,xdate,ydate,data])

acorr(x, *[, data])
xcorr( x,y [,normed,detrend,usevlines,...])
cohere(x,y [,NFFT,Fs,Fc,detrend,...])

eventplot(positions [,orientation,...])
hlines(y,xmin,xmax [,colors,linestyles,...])

vlines( x,ymin,ymax [,color,linestyles,...])
2)绘图
bar(x,height [,width,bottom,align,data])
barh(y,width [,height,left,align])
barbs(* args [,data])
colorbar([mappable,cax,ax])
errorbar(x,y [,yerr,xerr,fmt,ecolor,...])

hist(x [,bins,range,density,weights,...])
hist2d(x,y [,bins,range,density,...])

pie(x[, explode, labels, colors, autopct, ...])

scatter(x,y [,s,c,标记,cmap,范数,...])

polar(* args,** kwargs)
rgrids([半径,标签,角度,fmt])

stackplot(x,* args [,label,color,...])

stem(* args [,linefmt,markerfmt,basefmt,...])

step(x,y,* args [,where,data])

box([on])
boxplot(x [,notch,sym,vert,whis,...])
broken_barh(xranges,yrange,* [,data])

violinplot( dataset [,position,vert,...])

pcolor(* args [,shading,alpha,norm,cmap,...])
pcolormesh(* args [,alpha,norm,cmap,vmin,...])

streamplot(x,y,u,v [,density,linewidth,...])

specgram(x [,NFFT,Fs,Fc,detrend,window,...])

phase_spectrum(x [,Fs,Fc,window,pad_to,...])

psd(x[, NFFT, Fs, Fc, detrend, window, ...])

spy(Z [,precision,marker,markersize,...])

quiver(* args [,data])

loglog(* args,** kwargs)

hexbin(x,y [,C,gridsize,bins,xscale,...])

angle_spectrum(x[, Fs, Fc, window, pad_to, ...])
csd(x,y [,NFFT,Fs,Fc,detrend,window,...])
itude_spectrum(x [,Fs,Fc,window,...])

tricontour(* args,** kwargs)
tricontourf(* args,** kwargs)
tripcolor(* args [,alpha,norm,cmap,vmin,...])
triplot(* args,** kwargs)
3)当前图操作
show(* [,block])
pause(interval)
savefig(* args,** kwargs)

draw()
gcf()
clf()

sci(im)
gci()

contour(* args [,data])
contourf(* args [,data])

grid([b,which,axis])

fill(* args [,data])
fill_between(x,y1 [,y2,where,...])
fill_betweenx(y,x1 [,x2,where,step,...])
ight_layout(* [,pad,h_pad,w_pad,rect])

findobj([o,match,include_self])
get(obj,* args,** kwargs)
get_current_fig_manager()
get_figlabels()
get_fignums()
getp(obj,* args,** kwargs)
setp(obj,* args,** kwargs)

quiverkey(Q,X,Y,U,label,** kw)
4)读图和保存图像
imread(fname [,format])
imsave(fname,arr,** kwargs)
imshow(X [,cmap,norm,Aspect,...])
4、pyplot的其他功能函数
draw_if_interactive()
ginput([n,timeout,show_clicks,mouse_add,...])
ioff()
ion()
isinteractive()
waitforbuttonpress( [timeout])

xkcd( [scale,length,randomness])

uninstall_repl_displayhook()
install_repl_displayhook()

rc(group,** kwargs)
rc_context([rc,fname])
rcdefaults()

connect(cid)
connect(s,func)
二、示例
0. 绘图基本流程
作图基本流程:导入必要的包:开始创建画布>添加画图区域(或者创建子图)>标注(标题、x、y轴名称,刻度)>绘图(根据数据或函数)>添加图例>完成绘制>保存(可选)>显示。
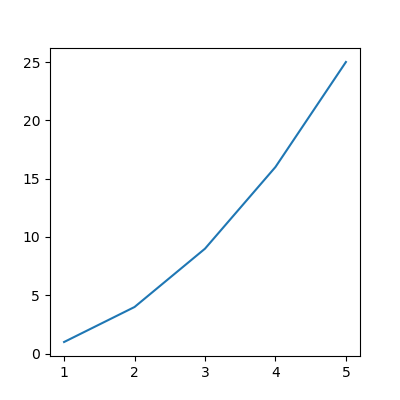
1. 绘制图形

import matplotlib.pyplot as plt
import numpy as np

fig1 = plt.figure(num=1, figsize=(4, 4))

ax = fig1.add_subplot(111)
ax.plot([1, 2, 3, 4, 5], [1, 4, 9, 16, 25])
plt.savefig("paowuxian.png")
plt.show()
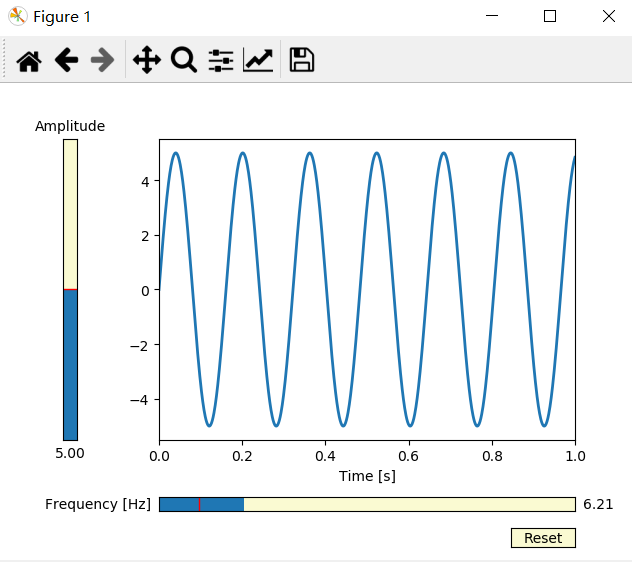
2. 绘制正弦频率和幅度可调节图像
import numpy as np
import matplotlib.pyplot as plt
from matplotlib.widgets import Slider, Button

def f(t, amplitude, frequency):
    return amplitude * np.sin(2 * np.pi * frequency * t)

t = np.linspace(0, 1, 1000)

init_amplitude = 5
init_frequency = 3

fig, ax = plt.subplots()
line, = plt.plot(t, f(t, init_amplitude, init_frequency), lw=2)
ax.set_xlabel('Time [s]')

axcolor = 'lightgoldenrodyellow'
ax.margins(x=0)

plt.subplots_adjust(left=0.25, bottom=0.25)

axfreq = plt.axes([0.25, 0.1, 0.65, 0.03], facecolor=axcolor)
freq_slider = Slider(
    ax=axfreq,
    label='Frequency [Hz]',
    valmin=0.1,
    valmax=30,
    valinit=init_frequency,
)

axamp = plt.axes([0.1, 0.25, 0.0225, 0.63], facecolor=axcolor)
amp_slider = Slider(
    ax=axamp,
    label="Amplitude",
    valmin=0,
    valmax=10,
    valinit=init_amplitude,
    orientation="vertical"
)

def update(val):
    line.set_ydata(f(t, amp_slider.val, freq_slider.val))
    fig.canvas.draw_idle()

freq_slider.on_changed(update)
amp_slider.on_changed(update)

resetax = plt.axes([0.8, 0.025, 0.1, 0.04])
button = Button(resetax, 'Reset', color=axcolor, hovercolor='0.975')

def reset(event):
    freq_slider.reset()
    amp_slider.reset()
button.on_clicked(reset)

plt.show()
三、参考资料
- matplotlib库- – –widgets,slider+button
Original: https://blog.csdn.net/beauthy/article/details/115369550
Author: 柏常青
Title: 你知道matplotlib的pyplot包有哪些函数?
原创文章受到原创版权保护。转载请注明出处:https://www.johngo689.com/767508/
转载文章受原作者版权保护。转载请注明原作者出处!