

这篇文章同样 以面向对象风格为主,介绍 设置图标题(title)和轴标签(xlabel,ylabel)的方法。
这篇文章分以下部分来介绍:
1. 设置图标题
2. 设置轴标签
1. 设置图标题
仍然使用面向对象风格,创建figure,创建axes,用axes画图,再调用axes模块里的函数,贴出一段基础代码
import matplotlib.pyplot as plt
x = [1,3,5,7]
y = [4,9,6,8]
创建figure,axes,并用axes画图
figure = plt.figure()
axes = figure.add_subplot(1,1,1)
axes.plot(x,y,'o-r')
显式在图标上方的名字
扩展参数:Text属性参数
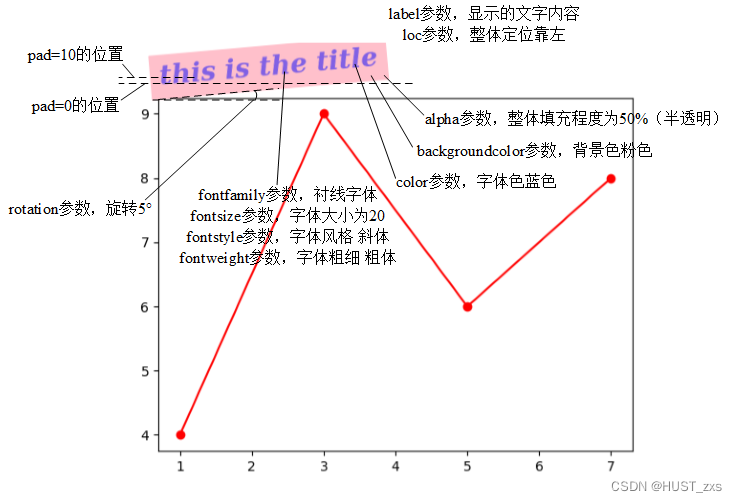
axes.set_title(label='this is the title',
fontdict=None, #也可以用这个设置字体参数
loc='left', #default: 'center'
pad=10, #default: 6.0
y=None, #default: None
# 扩展参数:Text属性参数(部分)
alpha=0.5,
backgroundcolor='pink',
color='blue',
fontfamily='serif',
fontsize=20,
fontstyle='italic',
fontweight='bold',
rotation=5
)
plt.show()
axes.set_title()参数含义已经标注在下面的执行得到的图片中。axes.plot()参数还包括Text属性参数,这里只设置部分Text属性参数。其余参数参考官网。
(axes.plot()函数完整参数参考官网:matplotlib.axes.Axes.set_title — Matplotlib 3.5.2 documentation)
执行可以得到以下图片,图中已经注释所设置的参数对应的效果(示意图,pad只是大概位置)

其他的包含Text属性参数的函数也可以参考这里的效果说明, Text属性参数的设置方法都是通用的。
同样,上面的一段代码等效于(pyplot风格)
pyplot函数用法
plt.title(…)
2. 设置轴标签
仍然使用面向对象风格,创建figure,创建axes,用axes画图,再调用axes模块里的函数,贴出一段基础代码
import matplotlib.pyplot as plt
x = [1,3,5,7]
y = [4,9,6,8]
创建figure,axes,并用axes画图
figure = plt.figure()
axes = figure.add_subplot(1,1,1)
axes.plot(x,y,'o-r')
x轴标签
扩展参数:Text属性参数
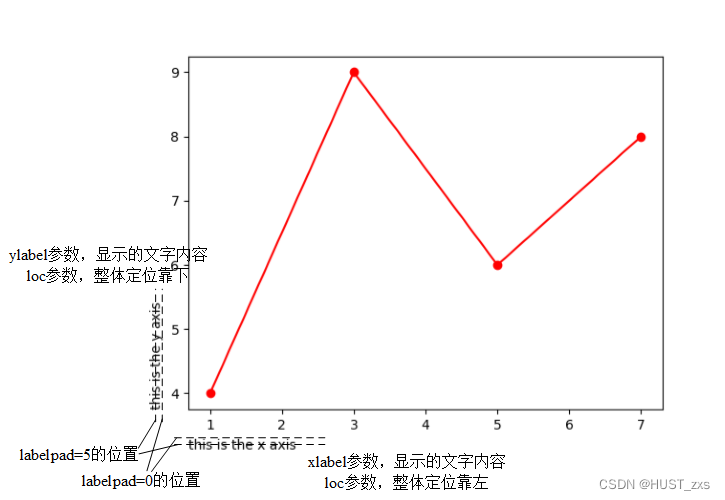
axes.set_xlabel(xlabel='this is the x axis',
fontdict=None,
labelpad = 5, #default: 4.0
loc='left', #default: 'center'
# 扩展参数:Text属性参数(省略)
)
y轴标签
扩展参数:Text属性参数
axes.set_ylabel(ylabel='this is the y axis',
fontdict=None,
labelpad = 5, #default: 4.0
loc='bottom' #default: 'center'
# 扩展参数:Text属性参数(省略)
)
plt.show()
axes.set_xlabel()和axes.set_ylabel()参数含义已经标注在下面的执行得到的图片中。axes.plot()参数还包括Text属性参数,可参考第一部分里的axes.set_title()函数里的Text属性参数的设置方法。其余参数参考官网。
(axes.set_xlabel()函数完整参数参考官网:matplotlib.axes.Axes.set_xlabel — Matplotlib 3.5.2 documentation
axes.set_ylabel()函数完整参数参考官网:matplotlib.axes.Axes.set_ylabel — Matplotlib 3.5.2 documentation)
执行可以得到以下图片,图中已经注释所设置的参数对应的效果(示意图,labelpad只是大概位置)
同样,上面的一段代码等效于(pyplot风格)
pyplot函数用法
plt.xlabel(…)
plt.ylabel(…)
Original: https://blog.csdn.net/HUST_zxs/article/details/125882474
Author: HUST_zxs
Title: matplotlib入门基础(四)图标题和轴标签
原创文章受到原创版权保护。转载请注明出处:https://www.johngo689.com/765234/
转载文章受原作者版权保护。转载请注明原作者出处!