

(注意之前代码有错误目前已更新)
最近学习黑红二叉树,我想如果把二叉树可视化在操作的时候如果出错会比较容易发现。
在网上搜了一圈只有比较简单的ascii 的代码。
自己用Ipython写了一个,比较适合学生。
PS:算法没有做优化,加上matplotlib本身就慢,不适合较高的树。
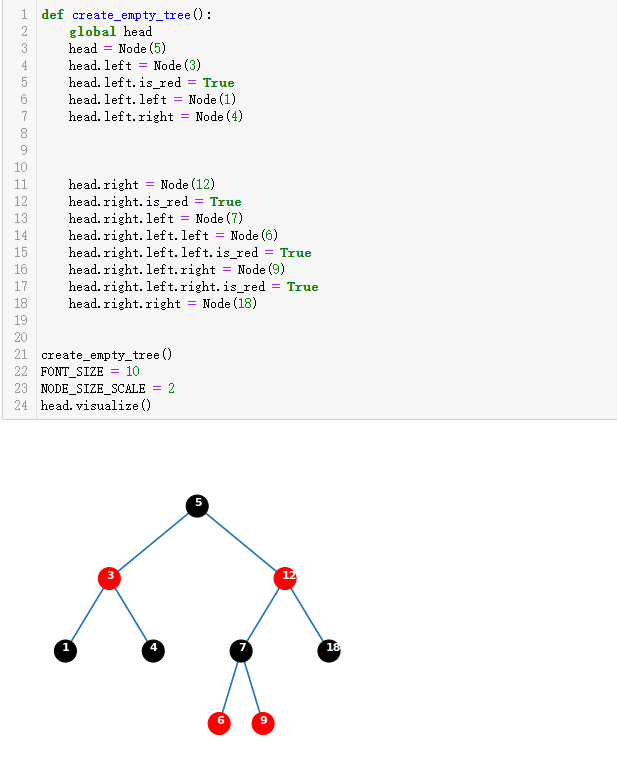
效果见图:

基本算法:
首先获取二叉树的高度 h,二叉树在所有节点都有左右在子节点的情况下,在高度 y时 X轴包含节点
个。比如 高度 2 有
= 2个节点.
创建一个Y轴长度相同的二维矩阵,X轴包含了所有节点和节点左右的空白区域,长度为
。在遍历矩阵中所有元素的时候,如果 坐标 (x,y)中包含了一个节点则检测它的子节点,这时候把它的子节点放入到二维矩阵当中
如左侧子节点坐标为 (x_,y_),
y_
,
x_的坐标需要计算偏移量,这里称为
, x_ 。
偏移量从树冠底部到根部是依次乘以2的,在实现可视化的时候如果将树根底部偏移量设置为1,那么 偏移量的计算公式如下:
由于y在程序中是以0开始的所以python中 matrix 为二维矩阵该计算方式为
dx = 2**(len(matrix) – y – 2)
获取到偏移量之后只需要遍历 y 轴, x轴,
检测到节点时检测左右,然后把子节点放置到二维矩阵中即可。
在实现可视化的时候节点已经在矩阵中,提取(x,y)坐标并绘制或者输出字符串即可
PS:
使用二维矩阵是因为数据整理之后比较方便处理,可以绘制也可以直接输出字符串。
如果需要优化直接计算偏移量即可
import matplotlib.pyplot as plt
import matplotlib.lines as mlines

class Node():
    def __init__(self):
        self.is_red = False
        self.left = None
        self.right = None
        self.value = 0

    def get_height(self): #返回树高度,未优化算法应该比较慢
        layers = [self]
        layer_count = 0
        while layers:
            layer_count += 1
            new_list = []
            for node in layers:
                if node.left:
                    new_list.append(node.left)
                if node.right:
                    new_list.append(node.right)
            layers = new_list
        return layer_count

    def visualize(self,axis='off'):
        '''
            基本算法: 将树状结构映射到二维矩阵中,
            如果节点左右下方有节点则把该节点加入到矩阵中的坐标中,
            如节点(x,y)左下方有节点则把节点放入(x+offset,y+1)
            offset为x坐标偏移量,
            offset = 2**(len(matrix)-y-2)
        '''
        figure, axes = plt.subplots(figsize=(8, 6), dpi=80)
        height = self.get_height()
        width_ = 2**(height-1)
        width = 2 * width_ + 1
        matrix = [[[]for x in range(width)] for y in range(height)]

        matrix[0][width_] = head #put head in the middle position

        for y in range(len(matrix)):
            for x in range(len(matrix[y])):
                node = matrix[y][x]
                if node:
                    x1, y1 = (1/width)*(x+0.5), 1-(1/height)*y-0.2
                    axes.text(x1, y1, str(node.value),color='white',fontsize=FONT_SIZE,fontweight='bold')
                    offset = 2**(len(matrix)-y-2)

                    if node.left:
                        matrix[y+1][x-offset] = node.left
                        x2,y2 = (1/width)*(x-offset+0.5),1-(1/height)*(y+1)-0.2
                        line = mlines.Line2D([x1,x2], [y1,y2],zorder= -1)
                        axes.add_line(line)
                    if node.right:
                        matrix[y+1][x+offset] = node.right
                        x2,y2 = (1/width)*(x+offset+0.5),1-(1/height)*(y+1)-0.2
                        line = mlines.Line2D([x1,x2], [y1,y2],zorder= -1)
                        axes.add_line(line)
                    cc = plt.Circle(   ((1/width)*(x+0.5), 1-(1/height)*y-0.2 ),
                                        1/width/2*NODE_SIZE_SCALE,
                                        color=('r' if node.is_red else 'black' ))
                    axes.set_aspect(1)
                    axes.add_artist(cc,)

        plt.axis(axis)
        plt.show()

def create_empty_tree():
    global head
    head = Node()
    head.left = Node()
    head.left.is_red = True
    head.right = Node()
    head.right.left = Node()
    head.left.left = Node()

    head.left.right = Node()

create_empty_tree()

FONT_SIZE = 15
NODE_SIZE_SCALE = 0.5
head.visualize()
Original: https://blog.csdn.net/ChillingKangaroo/article/details/123196629
Author: Vogelbaum
Title: (Ipython)Matplotlib 中将二叉树可视化
原创文章受到原创版权保护。转载请注明出处:https://www.johngo689.com/765075/
转载文章受原作者版权保护。转载请注明原作者出处!