

matplotlib.pyplot.bar
bar()条形图创建的函数
用法
matplotlib.pyplot.bar(x, height, width=0.8, bottom=None, *, align='center', data=None, **kwargs)
x为x轴方上的值,可以理解为x的坐标类型:float or array-likeheight条形图的高类型:float or array-like–––width条形的宽,用来控制条形图的宽窄度类型:float or array-like, 默认为0–––bottomy坐标最开始的数据,就是我们通常所说的y坐标从什么开始类型:float, array-like,默认为0–––align用来将条形和x轴坐标对齐的函数,可以理解为让条形图与x轴的数字居中对齐,或者边缘对齐值: {‘center’, ‘edge’},默认值为center
kwargs后面会再进行详解**
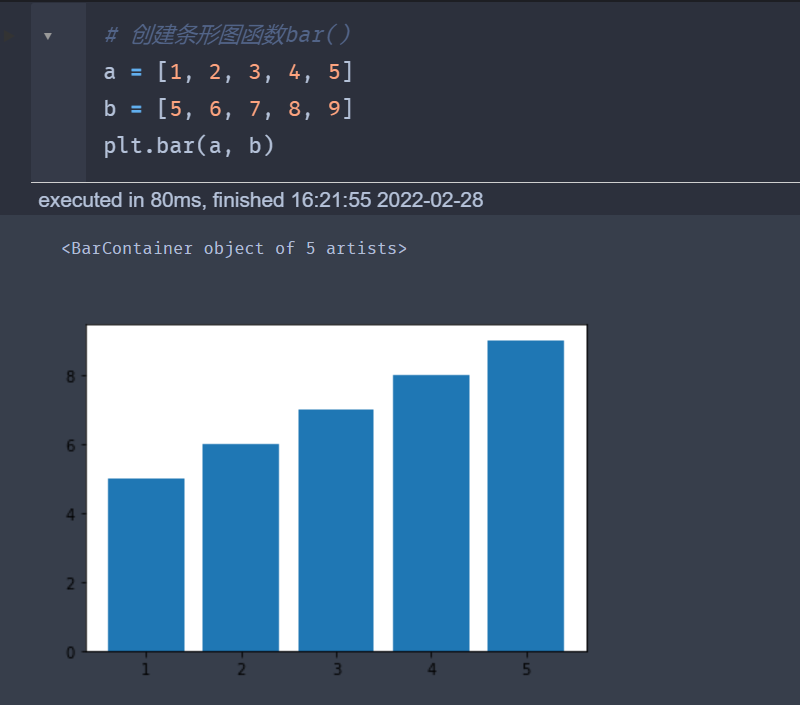
接下来看案例简单的例子:绘制一张普通的条形图,只有x,height参数
import matplotlib.pyplot as plt
import numpy as np
%matplotlib inline
x = [1, 2, 3, 4, 5]
height = [5, 6, 7, 8, 9, 10]
plt.bar(x, height)

添加上我们的 width参数
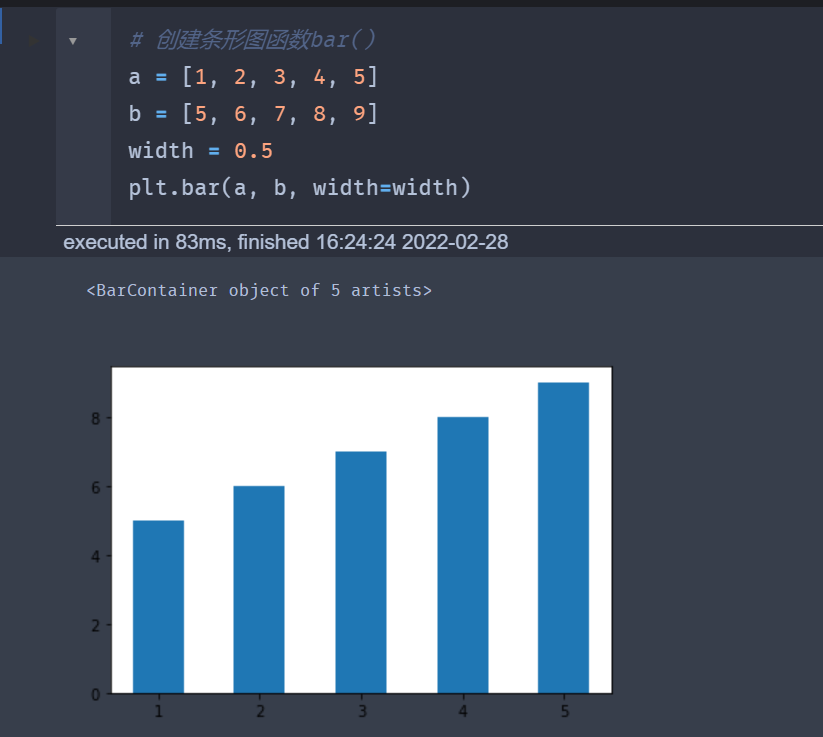
可以看出图形稍微变窄了
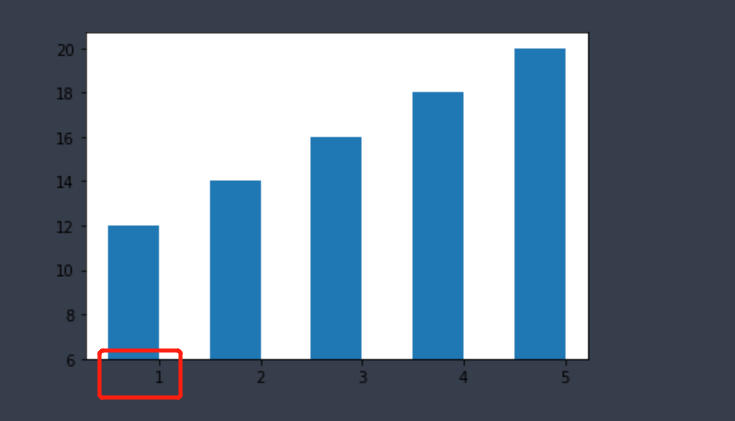
bottom参数
import matplitlib.pyplot as plt
import numpy as np
a = [1, 2, 3, 4, 5]
b = [6, 8, 10, 12, 14]
width = 0.5
bottom = 6
plt.bar(a, b, width, bottom)
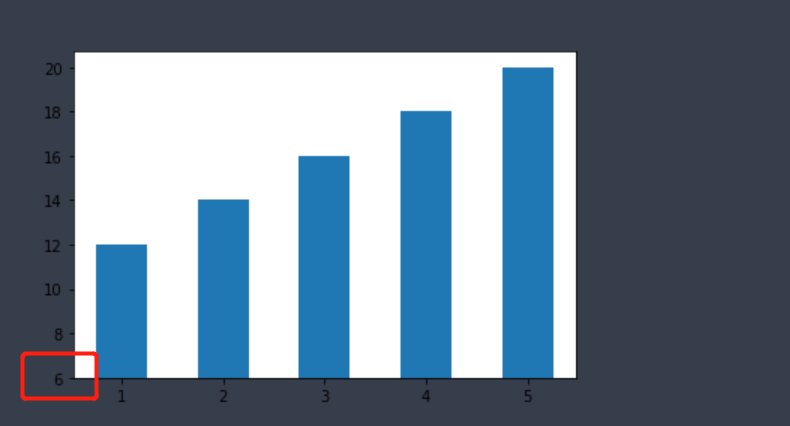
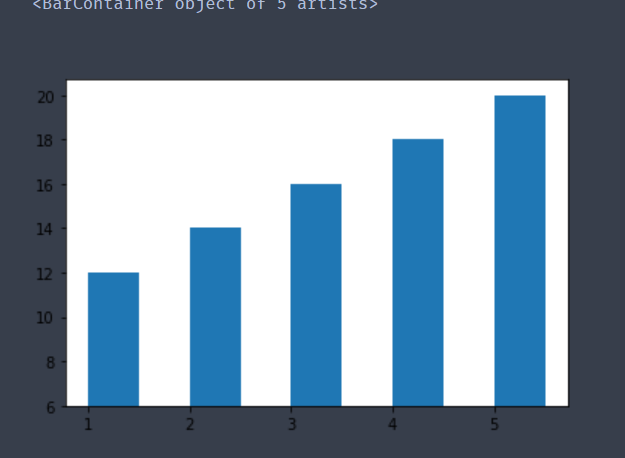
y轴坐标初始值变成6
*还有一个需要说明下,如果使用bottom扩展,也可化为甘特图 *
import matplotlib.pyplot as plt
import numpy as np
a = [1, 2, 3, 4, 5]
b = [6, 8, 10, 12, 14]
width = 0.5

bottom = [6, 9, 5, 4, 7]

plt.barh(a, b, width, bottom, align='edge')

align参数
“center”:将底座置于x位置的中心。
“edge”:将条的左边缘与x位置对齐。
要对齐右边缘上的条,需要传递负宽度并对齐=’edge’。
import matplotlib.pyplot as plt
import numpy as np
a = [1, 2, 3, 4, 5]
b = [6, 8, 10, 12, 14]
width = 0.5
bottom = 6

plt.bar(a, b, width, bottom, align='edge')

plt.bar(a, b, -0.5, bottom, align='edge')
与上面不同对齐方式不同
将条形图转变为横向的
使用函数 matplotlib.pyplot.barh
Original: https://blog.csdn.net/KIKI_ZSH/article/details/123184861
Author: Vergil_Zsh
Title: python绘制条形图(一)
原创文章受到原创版权保护。转载请注明出处:https://www.johngo689.com/765026/
转载文章受原作者版权保护。转载请注明原作者出处!