

文章目录
- 一、模块介绍
- 二、模块安装
- 三、主要API介绍
* - 设置绘图风格plt.style.use()
- 新建画布plt.figure()
- 绘制折线图plt.plot()
- 绘制垂直柱状图plt.bar()
- 绘制水平柱状图plt.barh()
- 绘制饼状图plt.pie()
- 绘制散点图plt.scatter()
- 设置横纵坐标的标签plt.xlabel(), plt.ylabel()
- 添加文字及属性设置 plt.text()
- 设置标题plt.title()
- 添加图例 plt.legend()
- 绘制多个子图plt.subplot()
- 多个子图中添加大标题
- 修改默认的属性设置
- 设置坐标轴的刻度
- 保存图片
- 四、示例代码
* - 拼接多张图片
- 绘制对比折线图
- 绘制对比柱状图
- 绘制对比柱状图并在柱子上显示值
- 绘制堆积柱状图
- 五、遇到的问题及解决办法
* - 中文显示乱码
一、模块介绍
matplotlib是基建立在python之上,适用于创建静态,动画和交互式可视化,通常与数据分析模块pandas搭配使用,用于数据的分析和展示,适用于主流的操作系统,如Linux,Win,Mac。


拼接多张图片
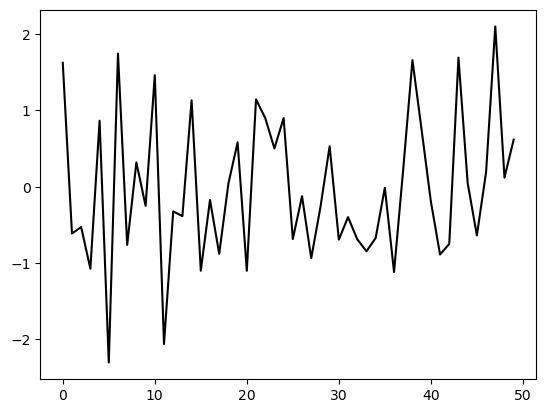
折线图
; 二、模块安装
如果是anaconda中内置的python,这个包是默认自带的;
当用pip安装时,可以使用清华源加速安装;
pip install matplotlib -i https://pypi.tuna.tsinghua.edu.cn/simple
三、主要API介绍
首先导入matplotlib,按照惯例简写为plt
import matplotlib.pyplot as plt
设置绘图风格plt.style.use()
plt.style.use(style) #设置图像风格样式
- style: 样式的名字或路径或URL 。
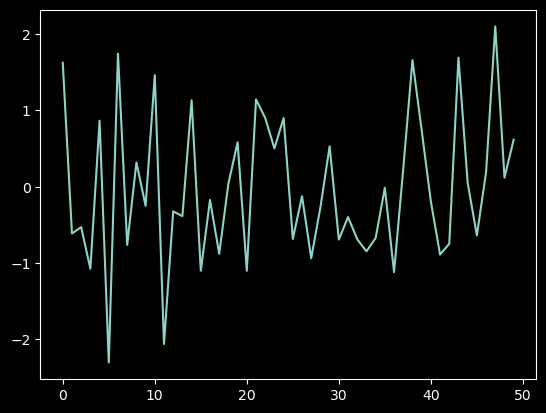
plt.style.use(‘dark_background’)
plt.style.use(‘fivethirtyeight’)
plt.style.use(‘seaborn-colorblind’)
plt.style.use(‘grayscale’)
print(plt.style.available) # 查看所有可选的风格
更多参考:https://blog.csdn.net/qq_42505705/article/details/84962815
新建画布plt.figure()
在绘图之前,需要新建一个画布,它的作用就类似于一张纸,可以在上面画,当绘制的图像过大,超过了界限,就可以预先设置一个合适的大小,当然,这步也可以根据实际情况进行省略;
matplotlib.pyplot.figure(num=None, figsize=None, dpi=None, facecolor=None, edgecolor=None, frameon=True, FigureClass=<class 'matplotlib.figure.figure'>, clear=False, **kwargs)
</class>
- num:int or str or Figure, optional 一个唯一的标识符
- figsize: 画布的宽度和高度,单位为英寸,默认为(6.4, 4.8)
- dpi: 每英寸的像素个数,默认为100
- facecolor:背景颜色, default: rcParams[“figure.facecolor”] (default: ‘white’)
- edgecolor::边框颜色 default: rcParams[“figure.edgecolor”] (default: ‘white’)
绘制折线图plt.plot()
matplotlib.pyplot.plot(*args, scalex=True, scaley=True, data=None, **kwargs)[source]
- x: 横坐标,可选的, 默认为 range(len(y))
- y: 纵坐标,即数据项,可以是一维或多维的列表或数组
- markersize: 标记大小
- color: 线条颜色
- marker: 数据标记的形状,默认是没有标记
- linestyle: 线条样式,默认为实线
- 更多参考:https://matplotlib.org/stable/api/_as_gen/matplotlib.pyplot.plot.html
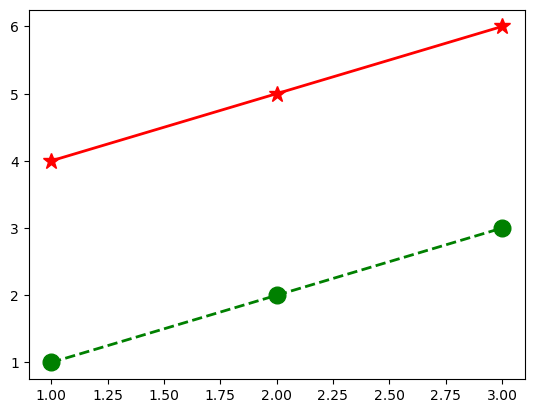
后面三个属性可以用一个字符串统表示:
x = [1, 2, 3]
y = [1, 2, 3]
以下两种写法等价,
plt.plot(x, y, color='green', marker='o', linestyle='dashed', linewidth=2, markersize=12)
plt.flot(x, y, 'go--',linewidth=2, markersize=12)
可以在一个画布上绘制多张图片,
y1 = [4, 5, 6]
plt.plot(x, y1, color='red', marker='*', linestyle='solid', linewidth=2, markersize=12)
plt.show()
显示如下:
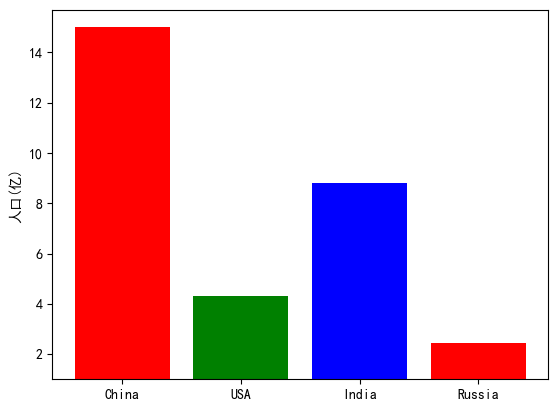
绘制垂直柱状图plt.bar()
matplotlib.pyplot.bar(x, height, width=0.8, bottom=None, *, align='center', data=None, **kwargs)
-
x: float or array-like 柱子的横坐标
The x coordinates of the bars. See also align for the alignment of the bars to the coordinates. -
height:float or array-like 柱子的高度
The height(s) of the bars. -
width:float or array-like, 柱子的宽度,default: 0.8
- bottom:float or array-like, y轴的起始值,default: 0
- align:柱子与x轴坐标的对齐方式,{‘center’, ‘edge’}, default: ‘center’
- lable:list[str] 将相应的横坐标替换成标签,见代码
- https://matplotlib.org/stable/api/_as_gen/matplotlib.pyplot.bar.html
import matplotlib.pyplot as plt
import seaborn as sns
sns.set_style({'font.sans-serif':['simhei','Arial']})
name_list = ['China', 'USA', 'India', 'Russia']
num_list = [14, 3.3, 7.8, 1.46]
plt.bar(range(len(num_list)), num_list, color='rgb',tick_label=name_list,bottom=1)
plt.bar(range(len(num_list)), num_list, color=['r', 'g', 'b'], tick_label=name_list,bottom=1)

plt.ylabel("人口(亿)")
plt.show()
显示如下:
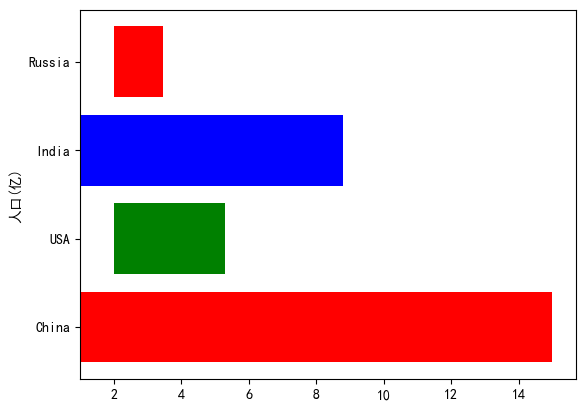
绘制水平柱状图plt.barh()
matplotlib.pyplot.barh(y, width, height=0.8, left=None, *, align='center', **kwargs)[source]
- y:float or array-like 柱子在y轴上的坐标
- width:float or array-like 柱子的宽度,即水平长度
- height:float or array-like, 柱子的高度,与垂直柱状图中的宽度相对应 default: 0.8
- left:float or array-like,每个柱子在x方向的起始坐标 default: 0
- align:柱子同y轴坐标的对齐方式, {‘center’, ‘edge’}, default: ‘center’
- tick_lable:list[str] 将相应的纵坐标替换成标签,见代码
- 更多参考:https://matplotlib.org/stable/api/_as_gen/matplotlib.pyplot.barh.html
import matplotlib.pyplot as plt
import seaborn as sns
sns.set_style({'font.sans-serif':['simhei','Arial']})
name_list = ['China', 'USA', 'India', 'Russia']
num_list = [14, 3.3, 7.8, 1.46]
plt.barh([1, 2, 3, 4], num_list, color='rgb', left=[1, 2, 1, 2], tick_label = name_list)
plt.ylabel("人口(亿)")
plt.savefig('test2.png', bbox_inches='tight')
plt.show()
显示如下:
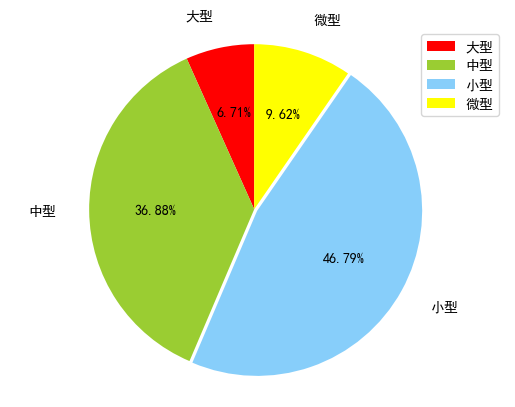
绘制饼状图plt.pie()
matplotlib.pyplot.pie(x, explode=None, labels=None, colors=None, autopct=None, pctdistance=0.6, shadow=False, labeldistance=1.1, startangle=0, radius=1, counterclock=True, wedgeprops=None, textprops=None, center=0, 0, frame=False, rotatelabels=False, *, normalize=None, data=None)
- x:float or array-like,如果s u m ( x ) > 1 sum(x)>1 s u m (x )>1,每部分区域的大小为x i / s u m ( x ) x_i / sum(x)x i /s u m (x ),如果。s u m ( x ) < 1 sum(x) < 1 s u m (x )<1,则直接使用其中的数值作为每个区域的占比,且将会有一部分空白的区域。
- explode:float or array-like,默认为None,如果不为空,表示每个部分距离两边区域的距离,单位为圆半径的长度。
- labels:list, default: None 每个区域对应的字符串序列。
- colors:array-like, default: None 每个区域对应的颜色。
- autopct:None or str or callable, default: None 如果非None,表示每个区域对应的数值,可以是格式化的形式(如”%3.2f%%”,后两个百分号会转义成一个百分号)或者可以调用函数。
- pctdistance:float, default: 0.6 表示每个区域中的文字距离圆心的距离,单位为圆半径。
- shadow: bool, default: False 是否添加阴影。
- labeldistane:图例距离圆心的距离,单位为半径长度。
- startangle:float, default: 0 degrees 饼图的起点从x轴逆时针旋转的角度。
- radius:float, default: 1 饼图半径长度。
- 更多参考:https://matplotlib.org/stable/api/_as_gen/matplotlib.pyplot.pie.html
import matplotlib.pyplot as plt
import seaborn as sns
sns.set_style({'font.sans-serif':['simhei','Arial']})
labels = ['大型','中型','小型', '微型'] #定义标签
sizes = [46, 253, 321, 66] #每块值
colors = ['red','yellowgreen','lightskyblue','yellow'] #每块颜色定义
explode = (0, 0, 0.02, 0) #将某一块分割出来,值越大分割出的间隙越大
patches,text1,text2 = plt.pie(sizes,
                      explode=explode,
                      labels=labels,
                      colors=colors,
                      labeldistance = 1.2,#图例距圆心半径倍距离
                      autopct = '%3.2f%%', #数值保留固定小数位
                      shadow = False, #无阴影设置
                      startangle =90, #逆时针起始角度设置
                      pctdistance = 0.6) #数值距圆心半径倍数距离
x,y轴刻度设置一致,保证饼图为圆形
plt.axis('equal')
plt.legend()
plt.savefig('test2.png', bbox_inches='tight')
plt.show()
显示如下:
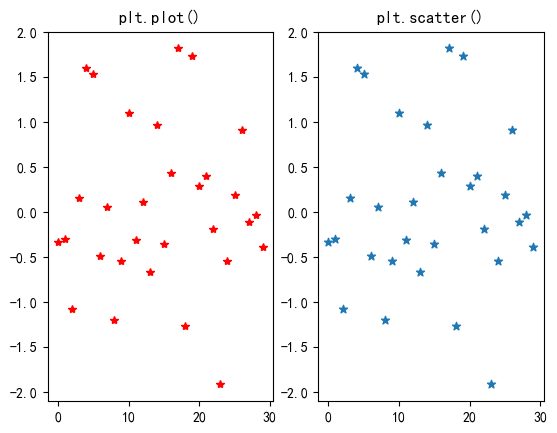
绘制散点图plt.scatter()
matplotlib.pyplot.scatter(x, y, s=None, c=None, marker=None, cmap=None, norm=None, vmin=None, vmax=None, alpha=None, linewidths=None, *, edgecolors=None, plotnonfinite=False, data=None, **kwargs)
- x,y: float, arrary-like, shape[n, ] 数据点的位置
-
s:点的大小 Default is rcParams[‘lines.markersize’] ** 2.
-
c: 点的颜色
- marker: 点的形状 default: rcParams[“scatter.marker”] (default: ‘o’)
- 更多参考:https://matplotlib.org/stable/api/_as_gen/matplotlib.pyplot.scatter.html#matplotlib.pyplot.scatter
import numpy as np
import matplotlib
from matplotlib import pyplot as plt
import seaborn as sns
sns.set_style({'font.sans-serif': ['simhei', 'Arial']})
matplotlib.rcParams['axes.unicode_minus'] = False # 显示负号
font = {'family': 'Times New Roman',
        'weight': 'normal',
        'size': 15,
        }
data = np.random.randn(30)
plt.subplot(121)
实现散点图的功能
plt.plot(data1, marker="*", linestyle="", c='red')
plt.title("plt.plot()")
plt.subplot(122)
plt.scatter(range(30), data1, marker="*")
plt.title("plt.scatter()")
plt.savefig('compare.png', bbox_inches='tight')
plt.show()
显示如下:
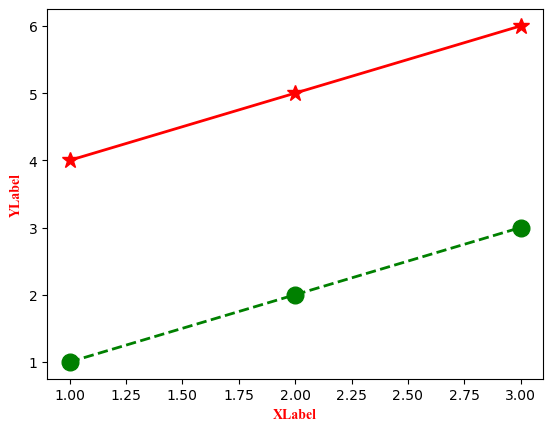
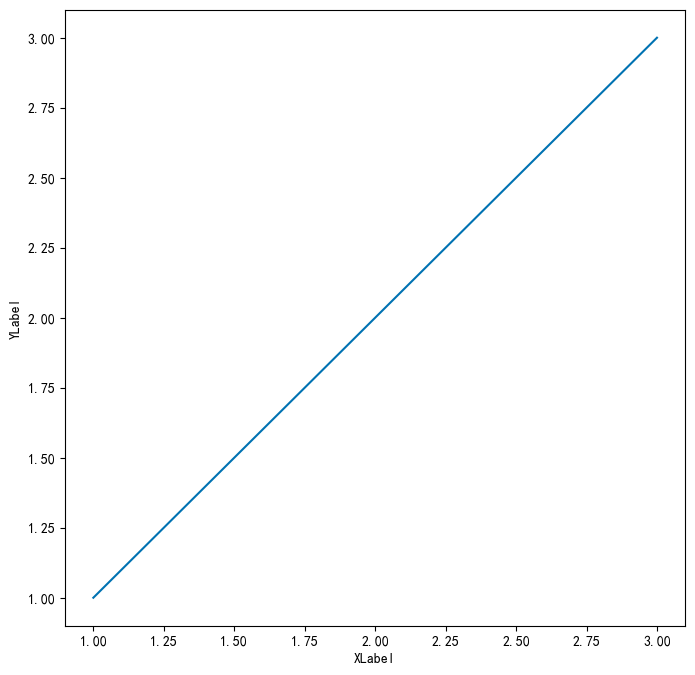
设置横纵坐标的标签plt.xlabel(), plt.ylabel()
先在开头添加如下代码,防止中文乱码
import seaborn as sns
sns.set_style({'font.sans-serif':['simhei','Arial']})
matplotlib.pyplot.xlabel(xlabel, fontdict=None, labelpad=None, *, loc=None, **kwargs)
matplotlib.pyplot.ylabel(ylabel, fontdict=None, labelpad=None, *, loc=None, **kwargs)
- xlabel / ylabel: 字符串,横坐标标签,
- fontdict: 将字体的属性存储在字典,传递给函数
- c or color: 字体颜色
- labelpad: 标签距离轴的长度,默认为4.0
- fontfamily or family: 字体种类
- fontsize or size:字体的大小, float or {‘xx-small’, ‘x-small’, ‘small’, ‘medium’, ‘large’, ‘x-large’, ‘xx-large’}
- fontweight or weigh: 字体的加粗程度 ,可选的值为{0-1000之间的数, ‘ultralight’, ‘light’, ‘normal’, ‘regular’, ‘book’, ‘medium’, ‘roman’, ‘semibold’, ‘demibold’, ‘demi’, ‘bold’, ‘heavy’, ‘extra bold’, ‘black’}
以下两种写法对label的属性设置等价
font = {'family' : 'Times New Roman',
'weight': 'heavy',
'size': 10,
'c':'red'}
plt.xlabel("XLabel",family='Times New Roman', weight='heavy', size=10, color='red')
plt.ylabel("YLabel", fontdict=font)
添加本段代码在plt.show()之前,显示如下:
NOTE:当label为中文时,设置某些属性时,显示有问题
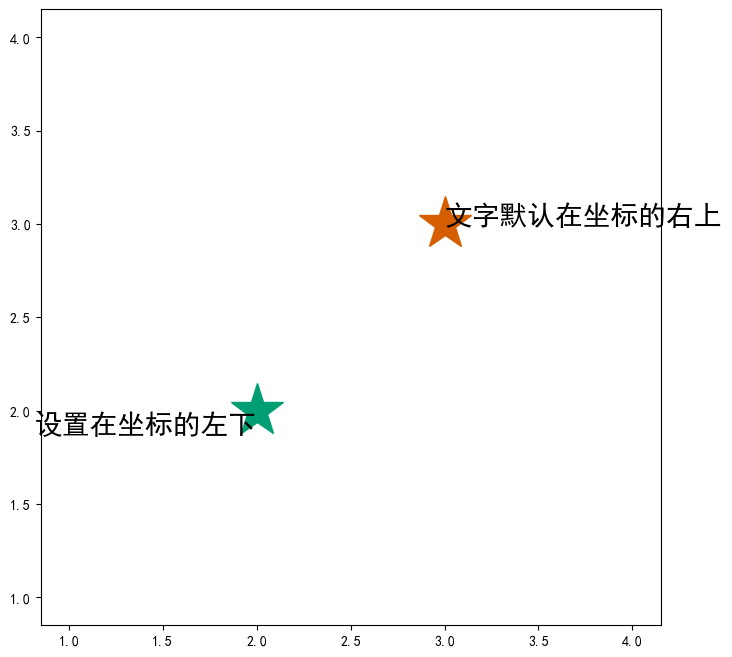
添加文字及属性设置 plt.text()
matplotlib.pyplot.text(x, y, s, fontdict=None, **kwargs)
- x: float,横坐标
- y: float,纵坐标
- s: str 要写的文字
- fontdict: 将字体的属性存储在字典,传递给函数
- fontfamily or family: {FONTNAME, ‘serif’, ‘sans-serif’, ‘cursive’, ‘fantasy’, ‘monospace’}
- fontsize or size: float or {‘xx-small’, ‘x-small’, ‘small’, ‘medium’, ‘large’, ‘x-large’, ‘xx-large’}
- fontstyle or style: {‘normal’, ‘italic’, ‘oblique’}
- fontvariant or variant: {‘normal’, ‘small-caps’}
- fontweight or weight: {a numeric value in range 0-1000, ‘ultralight’, ‘light’, ‘normal’, ‘regular’, ‘book’, ‘medium’, ‘roman’, ‘semibold’, ‘demibold’, ‘demi’, ‘bold’, ‘heavy’, ‘extra bold’, ‘black’}
- rotation: 文字的选择角度float or {‘vertical’, ‘horizontal’}
- horizontalalignment or ha: 坐标值(x, y)相对于文字的水平方位 {‘center’, ‘right’, ‘left’}
- verticalalignment or va: 坐标值(x, y)相对于文字的垂直方位{‘center’, ‘top’, ‘bottom’, ‘baseline’, ‘center_baseline’}
- 更多参考:https://matplotlib.org/stable/api/_as_gen/matplotlib.pyplot.text.html
"""
import matplotlib.pyplot as plt
import seaborn as sns
plt.style.use('seaborn-colorblind')
sns.set_style({'font.sans-serif':['simhei','Arial']})
fig = plt.figure(figsize=(8, 8), dpi=None)
plt.plot([1], [1])
plt.plot([2], [2], '*',  markersize=40)
plt.plot([3], [3], '*',  markersize=40)
plt.plot([4], [4],  markersize=40)
plt.text(x=2, y=2, fontsize=20, s="设置在坐标的左下", ha='right', va='top')
plt.text(x=3, y=3, fontsize=20, s="文字默认在坐标的右上")
plt.show()
显示如下:
设置标题plt.title()
matplotlib.pyplot.title(label, fontdict=None, loc='center', pad=None, **kwargs)
- label: str 标题内容
- fontdict: dict 将文字属性存储在字典中
- loc: 标题的水平位置,{‘center’, ‘left’, ‘right’},默认为center
- pad: 标题离上轴的距离,默认的值参考rcParams[‘axes.titlepad’]
- y: 标题的垂直位置,为负数时,会在图的下方 参考绘制子图的代码
添加图例 plt.legend()
当在一个图中绘制多种数据时,通过添加图例能更直观的表达每种图形的含义。
matplotlib.pyplot.legend(*args, **kwargs)
- labels: 字符串列表,图列的名称
- loc: 图例的位置,用多种可选的位置,默认自适应调整,具体参考下面的链接
- fontsize: 文字大小 int or {‘xx-small’, ‘x-small’, ‘small’, ‘medium’, ‘large’, ‘x-large’, ‘xx-large’},通过该参数可以调整图例的大小。
- labelcolor: str or list, 图例的颜色
- markerscale:float, 相对于图中数据标记的大小,default: rcParams[“legend.markerscale”] (default: 1.0)
- 更多参考:https://matplotlib.org/stable/api/_as_gen/matplotlib.pyplot.legend.html
用法:
- 为每一个线条添加图例
ax.plot([1, 2, 3], label='Inline label')
ax.legend()
等价的写法
line, = ax.plot([1, 2, 3])
line.set_label('Label via method')
ax.legend()
- 为存在的(多个)线条添加图例
plt.plot([1, 2, 3])
plt.plot([4, 5, 6])
plt.legend(['first line', 'second line'])
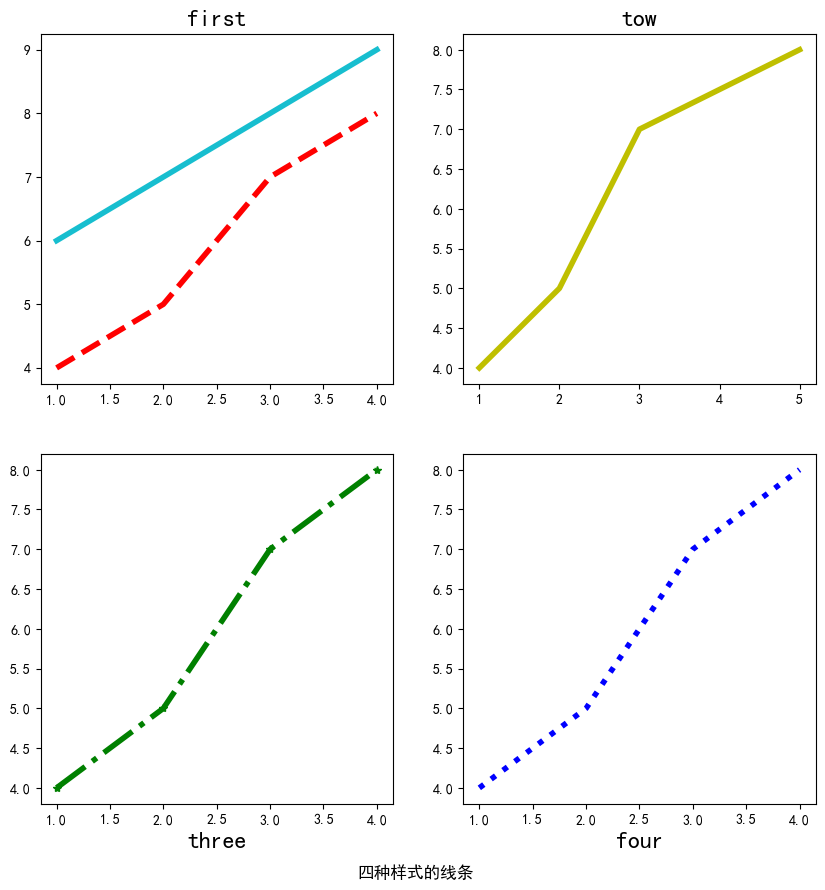
绘制多个子图plt.subplot()
增加一个新的坐标轴或选取存在的轴,这里的轴可以认为是一个子图。
matplotlib.pyplot.subplot(*args, **kwargs)
- *args:int, (int, int, index), or SubplotSpec, default: (1, 1, 1) ,该参数可以是如下的三种类型之一:
- (nrows, ncols, index) ,前两个为int,整个画布会被分成n r o w s 行 × n c o l s 列 nrows行 \times ncols列n ro w s 行×n co l s 列,index为整型时,值从一开始取,位置编号从左上到右下,也可以是一个二元组,表明该字符跨过的区域。
- 三个数位的整型 ,等价于(int, int, int)
- 一个存在的子图
- label: 子图的标题
- 更多参考:https://matplotlib.org/stable/api/_as_gen/matplotlib.pyplot.subplot.html
有三种调用方法:
subplot(nrows, ncols, index, **kwargs)
subplot(pos, **kwargs)
subplot(**kwargs)
subplot(ax)
import matplotlib
import matplotlib.pyplot as plt
import seaborn as sns
matplotlib.rcParams['lines.linewidth'] = 4
matplotlib.rcParams['axes.titlesize'] = 'xx-large'
sns.set_style({'font.sans-serif': ['simhei', 'Arial']})

fig = plt.figure(figsize=(10, 10), dpi=100)
ax1 = plt.subplot(221)  #该行可以换成 ax1 = fig.add_subplot(2,2,1)
#设置X轴、Y轴的刻度范围
#ax1.set_ylim(0, 1)
#ax1.set_xlim(0, 1)
#设置每个刻度对应的标签
#plt.xticks([1, 2, 3, 4], labels=["a", "b", "c", "d"])

plt.plot([1, 2, 3, 4], [4, 5, 7, 8], color="r", linestyle="--")
#在ax1中添加一条线
plt.plot([1, 2, 3, 4], [6, 7, 8, 9], color='#17becf', linestyle="-")
plt.title(label='first')  # 设置字体大小与格式

ax2 = plt.subplot(2, 2, 2)
plt.plot([1, 2, 3, 5], [4, 5, 7, 8], color="y", linestyle="-")
plt.title('tow')

ax3 = plt.subplot(223)
plt.plot([1, 2, 3, 4], [4, 5, 7, 8], marker='*', color="g", linestyle="-.")
plt.title('three', y=-0.15)
ax4 = plt.subplot(224)
plt.plot([1, 2, 3, 4], [4, 5, 7, 8], color="b", linestyle=":")
plt.title('four', y=-0.15)
fig.suptitle("四种样式的线条", y=0.05)  # 设置大标题及位置
plt.show()
显示如下:
多个子图中添加大标题
当在一个画布中存在多个子图,为所有的子图添加一个总的标题。
matplotlib.pyplot.suptitle(t, **kwargs)[source]
- t:str 标题名称
- x:float,default: 0.5 基本单位为宽度,左下角为(0,0)
- y:float,default: 0.98 基本单位为高度
-
horizontalalignment, ha{‘center’, ‘left’, ‘right’}, default: center
The horizontal alignment of the text relative to (x, y). -
verticalalignment, va{‘top’, ‘center’, ‘bottom’, ‘baseline’}, default: top
The vertical alignment of the text relative to (x, y). -
fontsize, sizedefault: rcParams[“figure.titlesize”] (default: ‘large’)
- fontweight, weightdefault: rcParams[“figure.titleweight”] (default: ‘normal’)
- 更多参考:https://matplotlib.org/stable/api/_as_gen/matplotlib.pyplot.suptitle.html
用法见绘制子图的代码
修改默认的属性设置
上面介绍的API中,有些参数即使不设置,如线条的颜色,形状,字体的大小等,也会提供默认的值,当然我们也可以修改默认的参数设置。首先查看默认的属性有哪些
print(matplotlib.rcParams)
会输出一大串预先设定好的属性及取值,下面改变五种默认的属性
import matplotlib.pyplot as plt
import seaborn as sns
import matplotlib
plt.style.use('seaborn-colorblind')
sns.set_style({'font.sans-serif':['simhei','Arial']})
print(matplotlib.rcParams)
fig = plt.figure(figsize=(8, 8), dpi=None)
修改默认的属性值
matplotlib.rcParams['axes.labelpad'] = 20
matplotlib.rcParams['axes.labelcolor'] = 'red'
matplotlib.rcParams['axes.labelsize'] = 15
matplotlib.rcParams['lines.marker'] = '*'
matplotlib.rcParams['lines.markersize'] = 20

x = [1, 2, 3]
y = [1, 2, 3]
plt.plot(x, y)
plt.xlabel('XLabel')
plt.ylabel('YLabel')
plt.show()
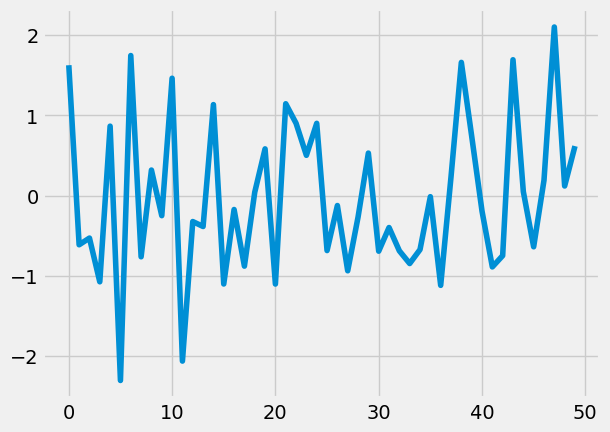
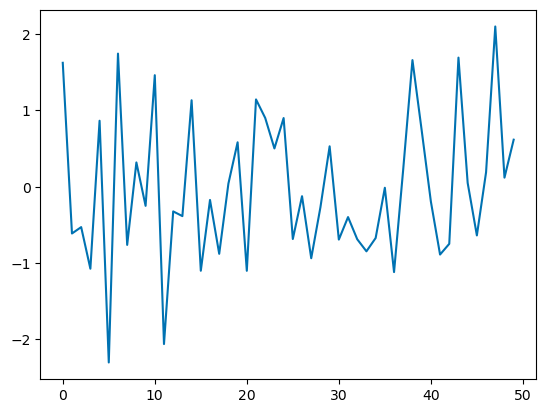
对比图如下:
默认属性时的团
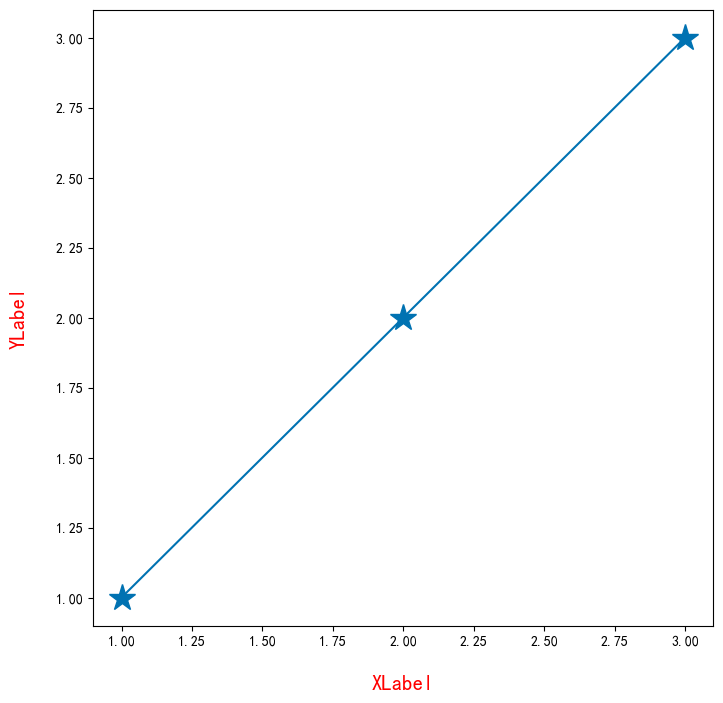
修改默认之后的图案
设置图例的位置
plt.legend(loc='upper right') #设置图例的位置
https://blog.csdn.net/qq_37710333/article/details/108308155
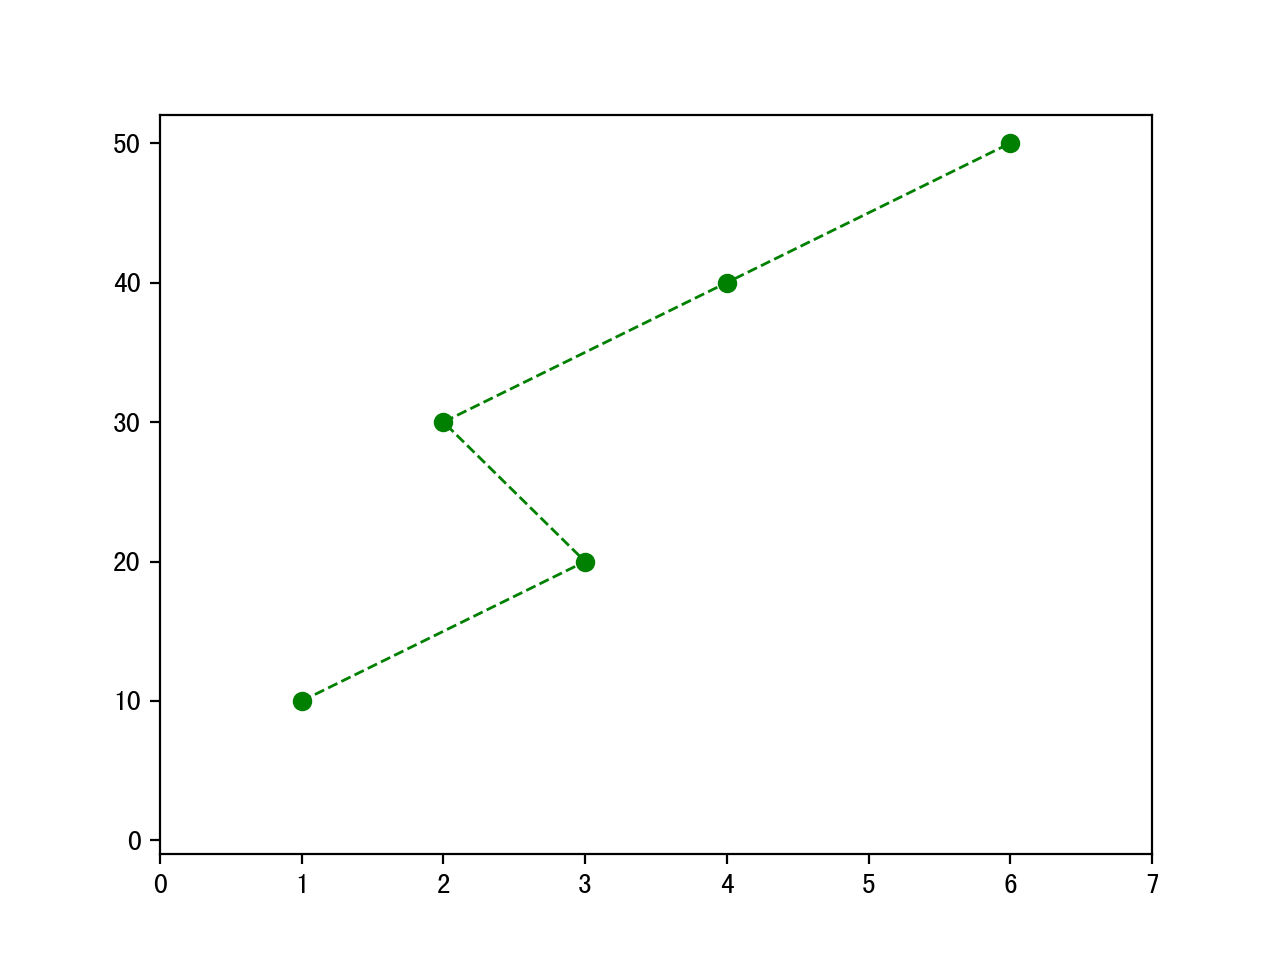
设置坐标轴的刻度
- 单个刻度
import matplotlib.pyplot as plt
import matplotlib.ticker as ticker
from matplotlib.ticker import MultipleLocator
x = [1, 3, 2, 4, 6]
y = [10, 20, 30, 40, 50]
设置x轴的刻度大小为1
x_major_locator=MultipleLocator(1)
设置y轴的刻度大小为10
y_major_locator=MultipleLocator(10)
ax=plt.gca()
ax.xaxis.set_major_locator(x_major_locator)
ax.yaxis.set_major_locator(y_major_locator)
plt.plot(x, y, color='green', marker='o', linestyle='dashed', linewidth=1, markersize=6)
设置x,y轴的范围
plt.ylim(-1, 52)
plt.xlim(0, 7)
plt.show()
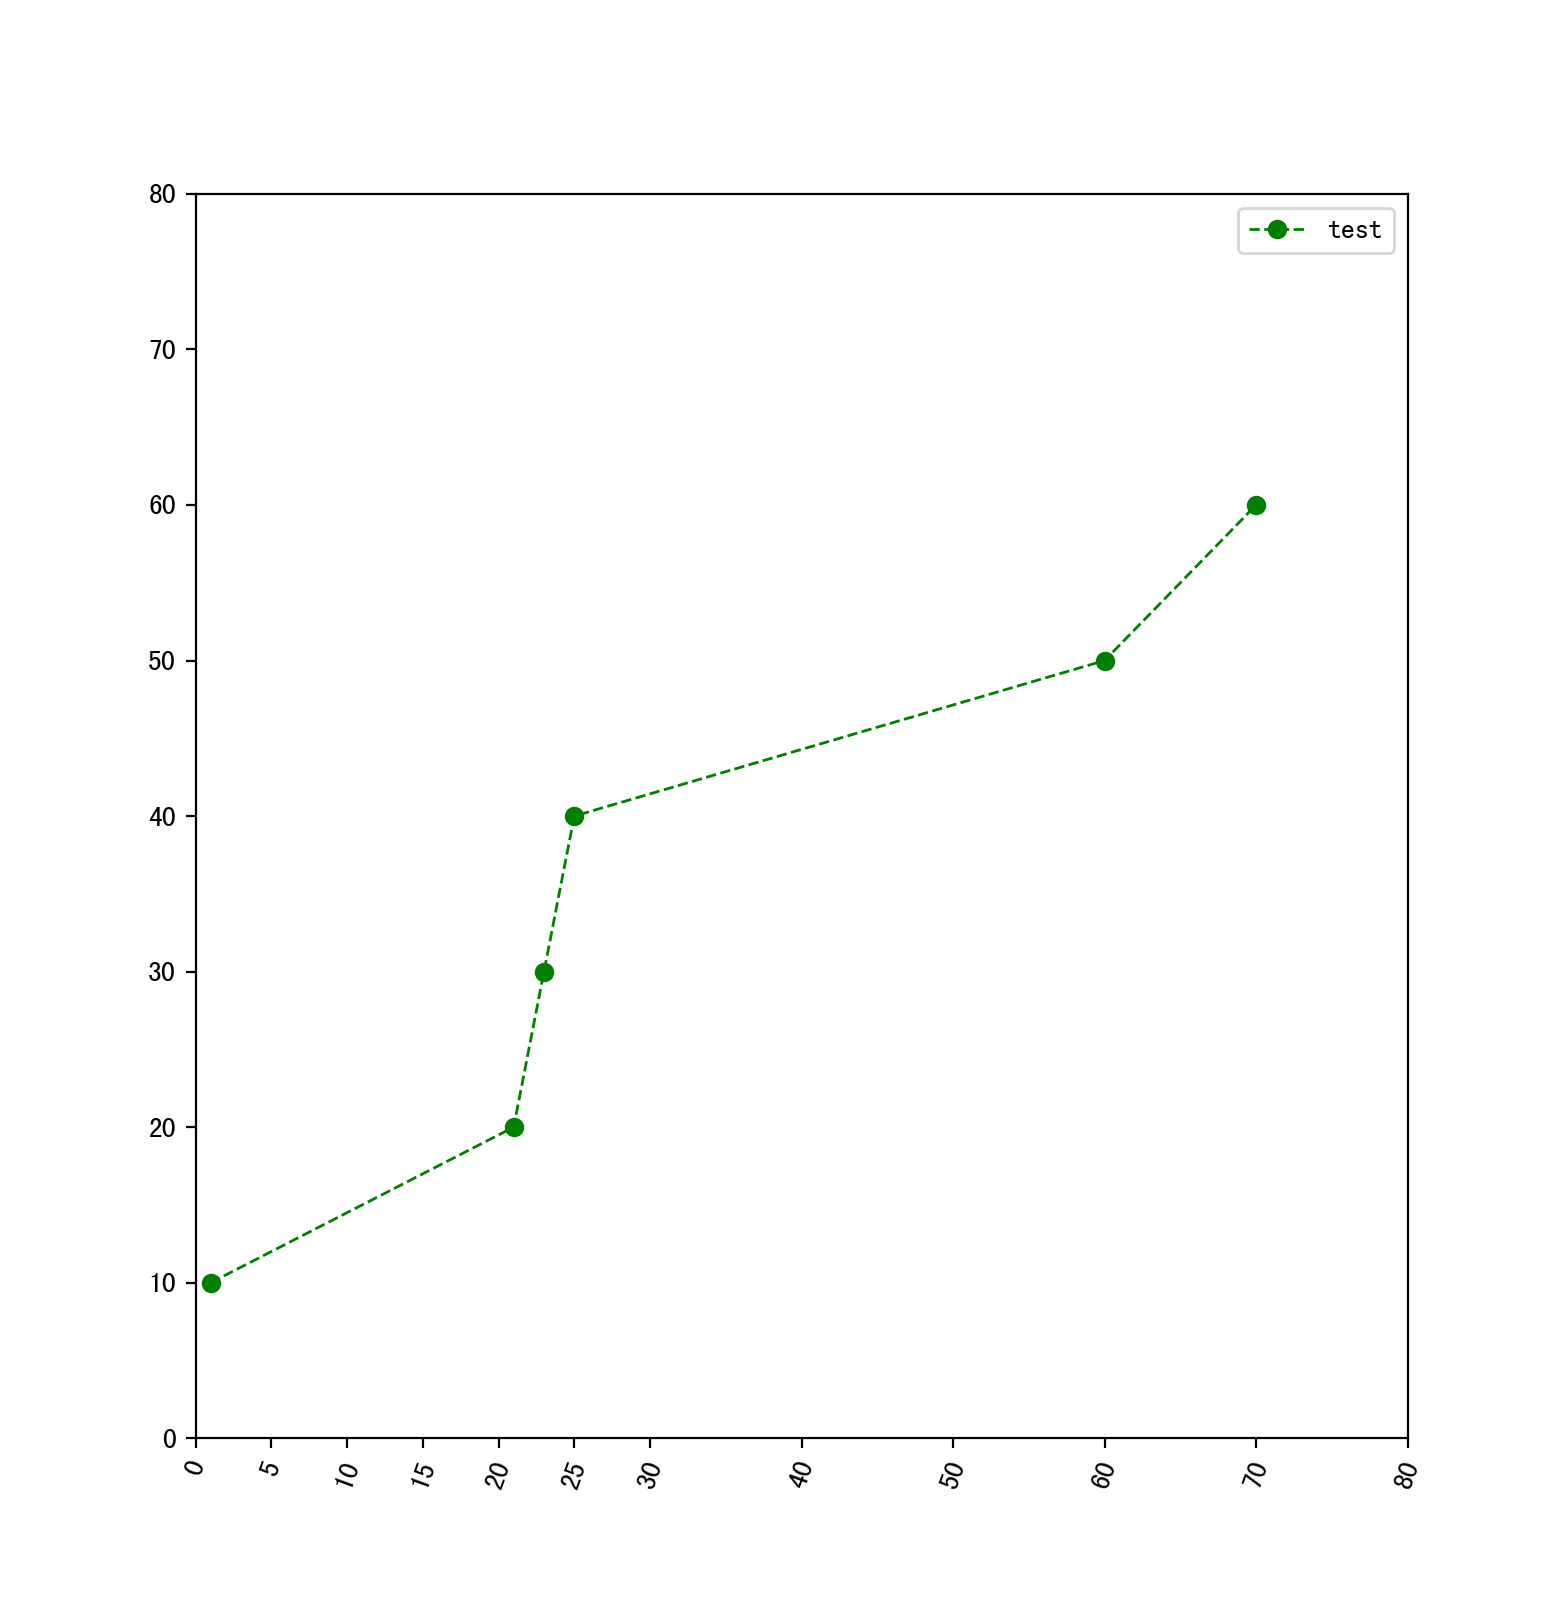
- 多个刻度
import matplotlib.pyplot as plt
import matplotlib.ticker as ticker
from matplotlib.ticker import MultipleLocator
设置多个刻度范围
plt.figure(figsize=(10, 10))
ran = []
x = [1, 21, 23, 25, 60, 70]
y = [10, 20, 30, 40, 50, 60]
设置两个刻度范围
ran.extend(range(0, 30, 5))
ran.extend(range(30, 90, 10))
plt.xticks(ran, rotation=70,fontsize=10)
plt.yticks(range(0, 90, 10), fontsize=10)
plt.xlim(0, 80)
plt.ylim(0, 80)
plt.plot(x, y, color='green', marker='o', linestyle='dashed', linewidth=1, markersize=6)
plt.legend(["test"], loc="best")
plt.show()
保存图片
matplotlib.pyplot.savefig(*args, **kwargs)
调用方法:
savefig(fname, dpi=None, facecolor='w', edgecolor='w',
        orientation='portrait', papertype=None, format=None,
        transparent=False, bbox_inches=None, pad_inches=0.1,
        frameon=None, metadata=None)
- fname: str 要保存的路径以名称,建议加上保存格式
- dpi: 每英寸的像素大小
- quality:int, default: rcParams[“savefig.jpeg_quality”] (default: 95) 保存的像素质量,只对’.jpg’ ‘jpeg’有效。
- bbox_inches:为”tight”时,可以去除保留图片时的空白边缘。
-
pad_inches: Amount of padding around the figure when bbox_inches is ‘tight’.
-
更多参考:https://matplotlib.org/stable/api/_as_gen/matplotlib.pyplot.savefig.html
*savefig()一定要在show()之前调用!!!
四、示例代码
拼接多张图片
import cv2
import seaborn as sns
from matplotlib import pyplot as plt
img = cv2.imread('picture.jpg')
sns.set_style({'font.sans-serif': ['simhei', 'Arial']})
plt.figure(figsize=(20, 10))
font = {'family': 'Times New Roman',
        'weight': 'normal',
        'size': 15,
        }
s = "label_{0:02d}"
for i in range(16):
    plt.subplot(4, 4, i + 1)
    plt.imshow(img, 'gray')
    plt.xlabel(s.format(i), font)
    plt.xticks([]), plt.yticks([])  # 取消刻度

plt.suptitle("拼接图片", fontsize=20, fontweight='bold')
plt.savefig('puzzle.png', bbox_inches='tight')
plt.show()

原图
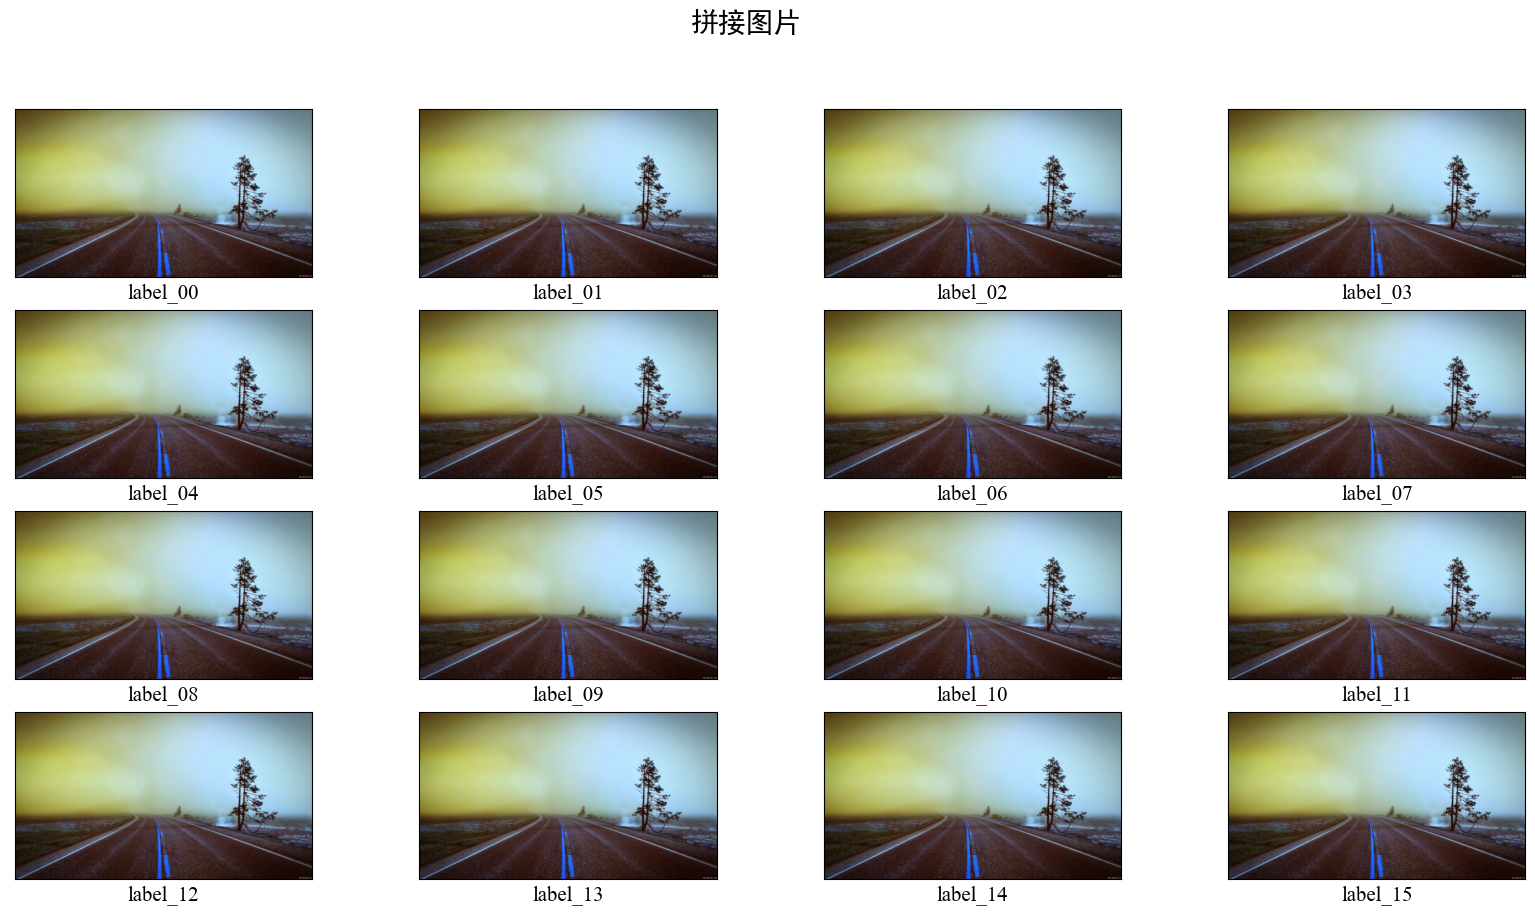
拼接图(存在较明显的色差)
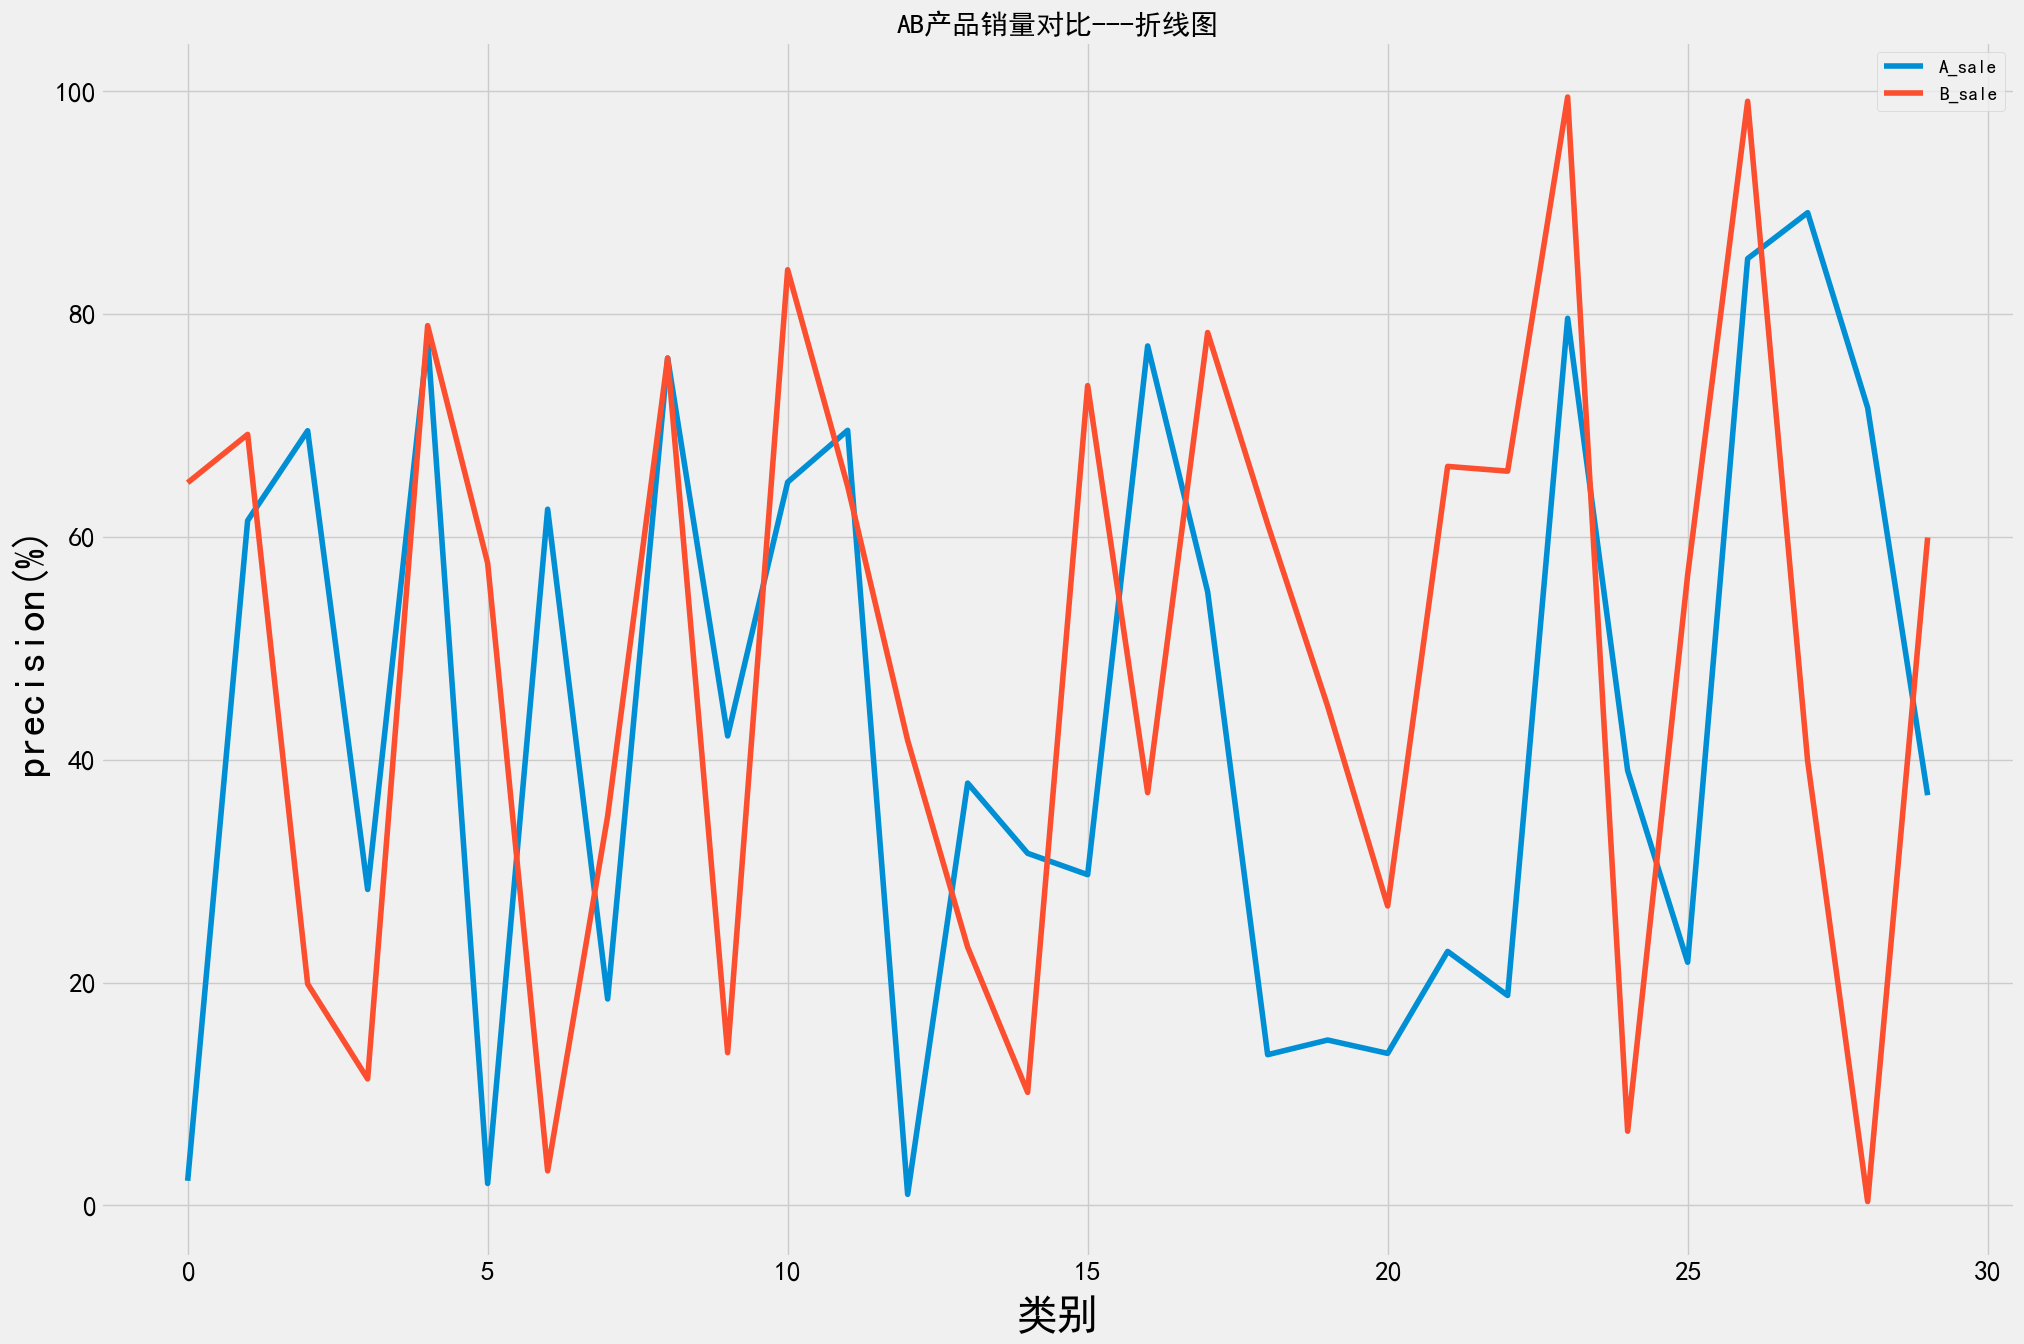
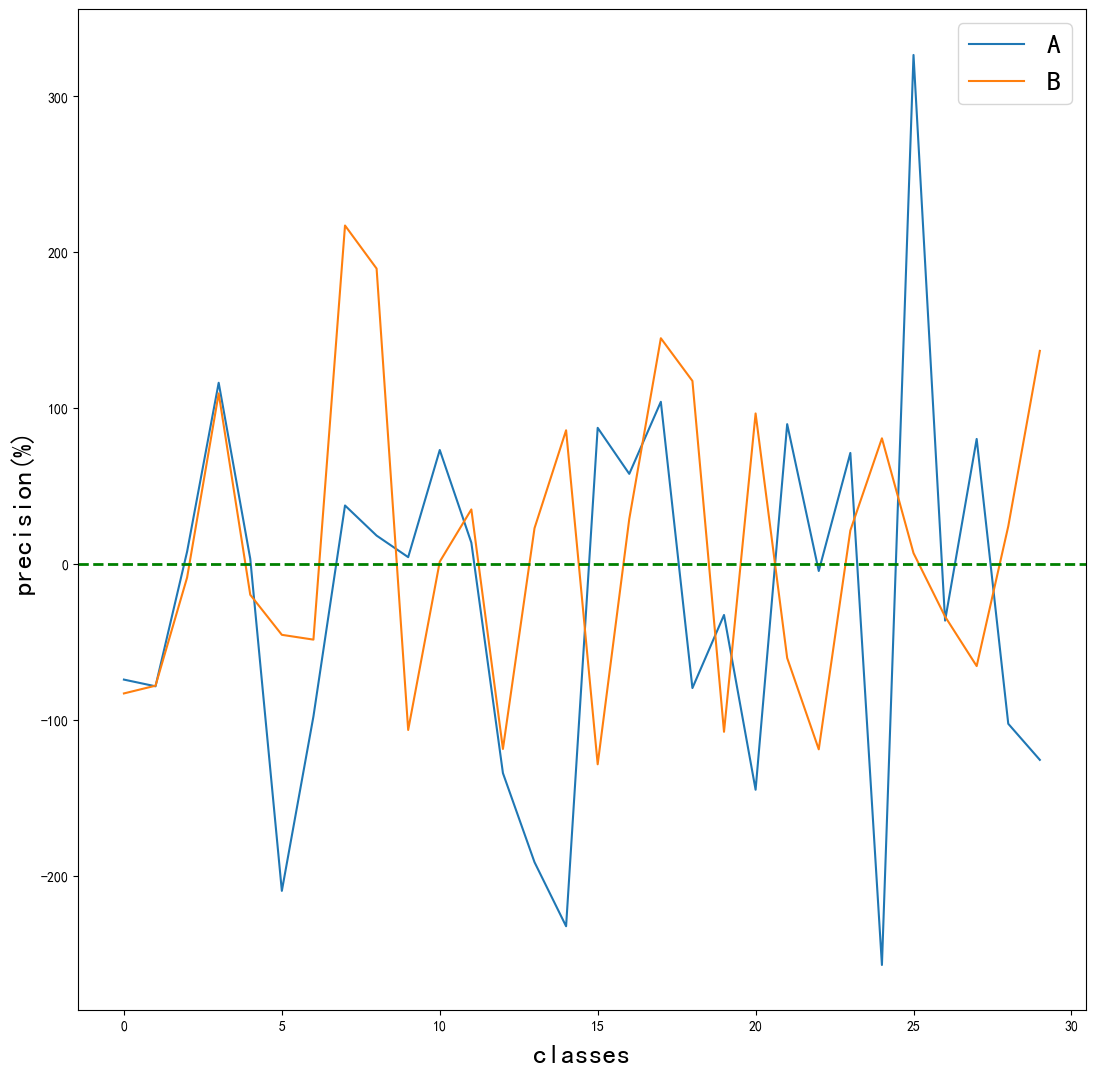
绘制对比折线图
import numpy as np
import matplotlib
from matplotlib import pyplot as plt
import seaborn as sns

sns.set_style({'font.sans-serif': ['simhei', 'Arial']})
matplotlib.rcParams['axes.unicode_minus'] = False # 显示负号

plt.figure(figsize=(13, 13))
font = {'family': 'Times New Roman',
        'weight': 'normal',
        'size': 15,
        }
data1 = np.random.randn(30) * 100
data2 = np.random.randn(30) * 100
plt.plot(data1, label="A")
plt.plot(data2, label="B")
plt.axhline(0, linestyle='--', color='green', lw=2) #插入水平线
plt.axvline(10, linestyle='--', color='green', alpha=0.8) //插入垂直线
plt.ylabel('precision(%)', fontsize=20)
plt.xlabel("classes",labelpad=8.5, fontsize=20)
plt.legend(fontsize=20)
plt.savefig('compare.png', bbox_inches='tight')
plt.show()
显示如下:
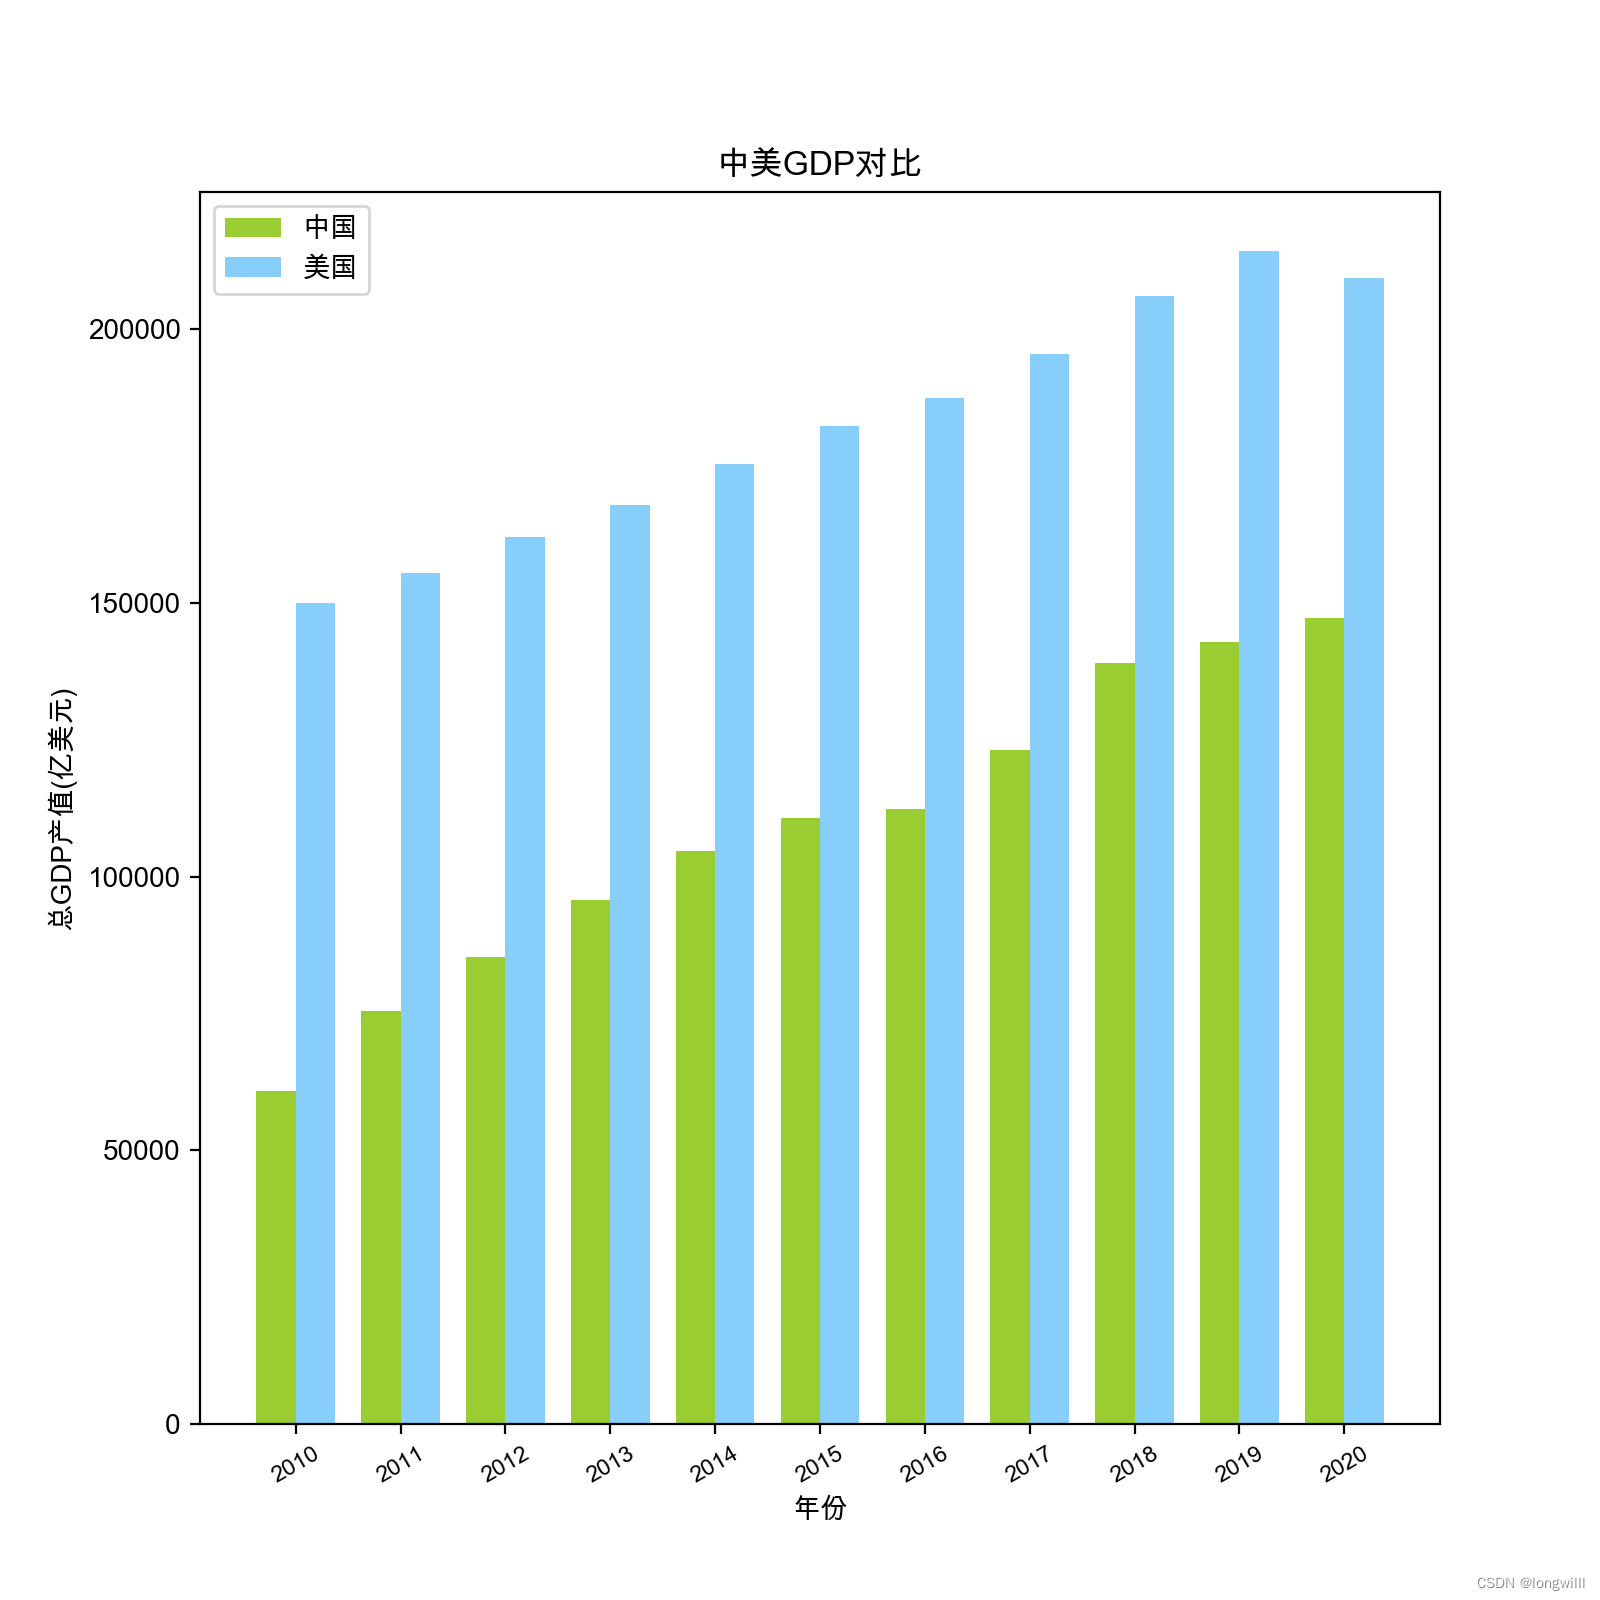
绘制对比柱状图
from matplotlib import rcParams
rcParams['font.family'] = 'Arial Unicode MS'
import matplotlib.pyplot as plt
tick_name = ['2010', '2011', '2012', '2013', '2014', '2015', '2016', '2017', '2018', '2019', '2020']
china_gdp = [60872, 75515, 85322, 95704, 104757, 110616, 112333, 123104, 138948, 142799, 147227]
usa_gdp = [149921, 155426, 161970, 167848, 175272, 182383, 187451, 195430, 206119, 214332, 209366]
a = 3
b = 8
x1 = [(i + 1) * b for i in range(11)]
x2 = [(i + 1) * b + a for i in range(11)]
x3 = [(i + 1) * b + a/2 for i in range(11)]
fig = plt.figure(figsize=(8, 8))
ax1 = fig.add_subplot(1, 1, 1)

plt.bar(x1, china_gdp, width=a, color='yellowgreen',label="中国")
plt.bar(x2, usa_gdp, width=a, color='lightskyblue',label="美国")
ticks = ax1.set_xticks(x3) # 设置刻度
labels = ax1.set_xticklabels(tick_name, rotation=30, fontsize = 'small') # 设置刻度标签
ax1.set_title("中美GDP对比")
plt.xlabel("年份")
plt.ylabel("总GDP产值(亿美元)")
plt.legend()  # 显示图例
plt.show()
显示如下:
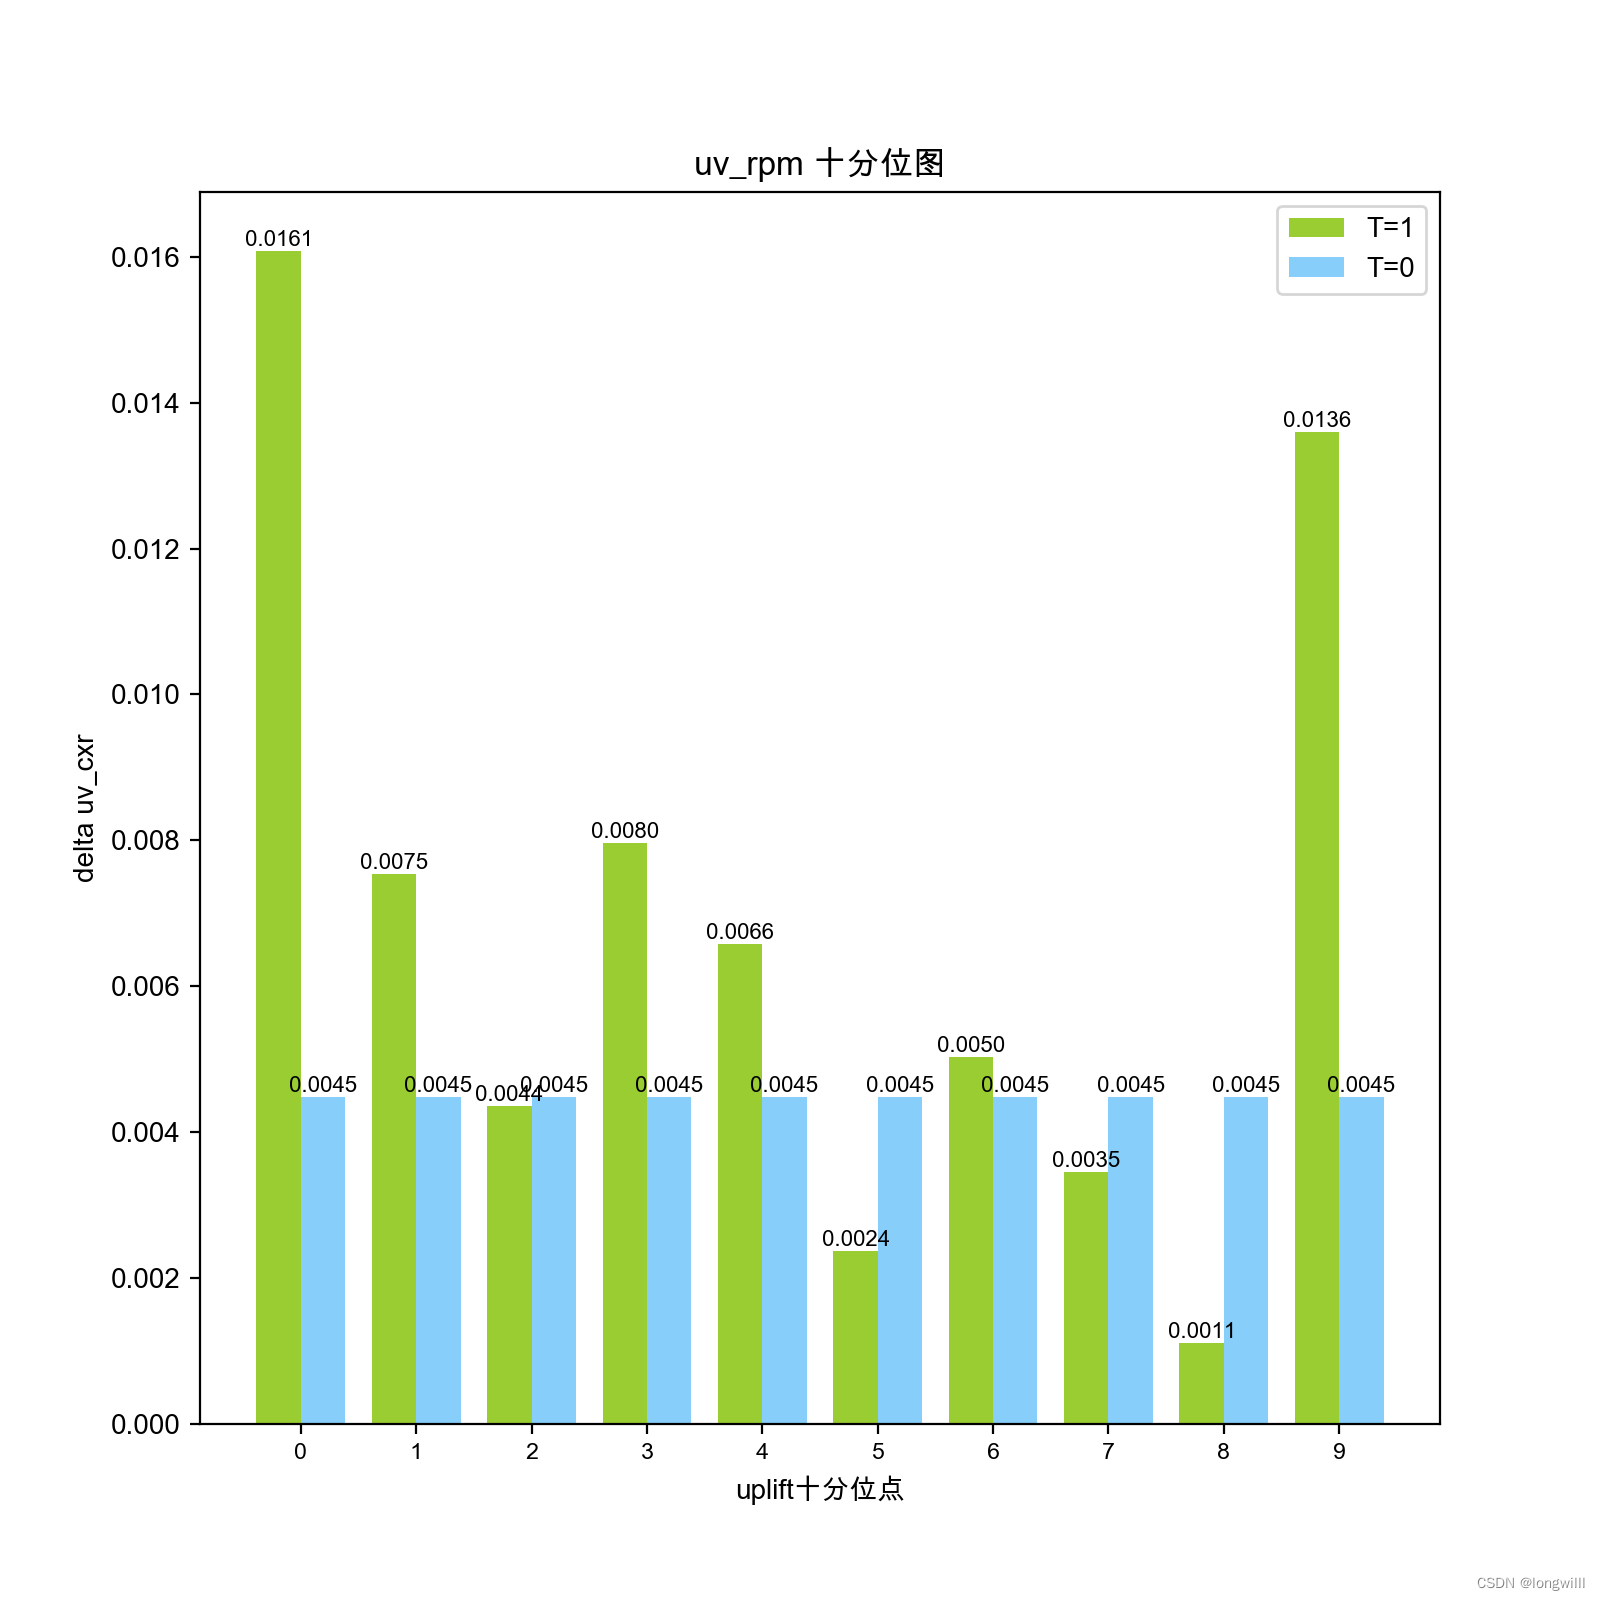
绘制对比柱状图并在柱子上显示值
from matplotlib import rcParams
rcParams['font.family'] = 'Arial Unicode MS'
import matplotlib.pyplot as plt
tick_name = ['0', '1', '2', '3', '4', '5', '6', '7', '8', '9']
cont = [5324.566083283042, 3194.3816086491624, 2370.236763831053, 1987.694984401248, 2155.7504175614413, 1709.760237388724, 1912.9140811455848, 1615.6501012990107, 1349.456136202412, 1810.7831325301204]
treat = [6092.455656759347, 3475.5420248328555, 3049.4914031501744, 2085.9832935560858, ]
23
num_list = [0.016082643, 0.007536573, 0.004361351, 0.007964208, 0.006583216, 0.002371007, 0.00502453, 0.003455287, 0.001115849, 0.013595492]# num_list_r = [0.0067604792575306424] * 10# # 24# num_list = [0.018650344, 0.006166104, 0.005329947, -7.46E-04, 0.00210835, 0.004344219, 0.003247764, 0.003496084, 2.46E-04, 0.008642287]# num_list_r = [0.005346123524244836] * 10# # 25# num_list = [0.017649752, 0.003290102, 0.001193554, 0.005288239, -0.002659459, 0.005013964, 0.004466062, 0.005354266, 0.00111815, 0.004642821]
num_list_r = [0.004483605580702439] * 10
调节柱子的
a = 5
调节柱子间的距离
b = 13
x1 = [(i + 1) * b for i in range(10)]
x2 = [(i + 1) * b + a for i in range(10)]
x3 = [(i + 1) * b + a/2 for i in range(10)]
fig = plt.figure(figsize=(8, 8))
ax1 = fig.add_subplot(1, 1, 1)
#调节字体大小
fontsize = 8
for i in range(10):
if(num_list[i] < 0):
plt.text(x=x1[i], y=num_list[i], fontsize=fontsize, s=format(num_list[i], '.4f'), ha='center', va='top')
else:plt.text(x=x1[i], y=num_list[i], fontsize=fontsize, s=format(num_list[i], '.4f'), ha='center', va='bottom')
if (num_list_r[i] < 0):
plt.text(x=x2[i], y=num_list_r[i], fontsize=fontsize, s=format(num_list_r[i], '.4f'), ha='center', va='top')
else:
plt.text(x=x2[i], y=num_list_r[i], fontsize=fontsize, s=format(num_list_r[i], '.4f'), ha='center', va='bottom')
plt.bar(x1, num_list, width=a, color='yellowgreen',label="T=1")
plt.bar(x2, num_list_r, width=a, color='lightskyblue',label="T=0")
ticks = ax1.set_xticks(x3)
设置刻度
labels = ax1.set_xticklabels(tick_name, rotation=0, fontsize = 'small')
设置刻度标签
ax1.set_title("uv_rpm 十分位图")
plt.ylabel("delta uv_cxr")
plt.xlabel("uplift十分位点")
plt.legend()
plt.show()
显示如下:
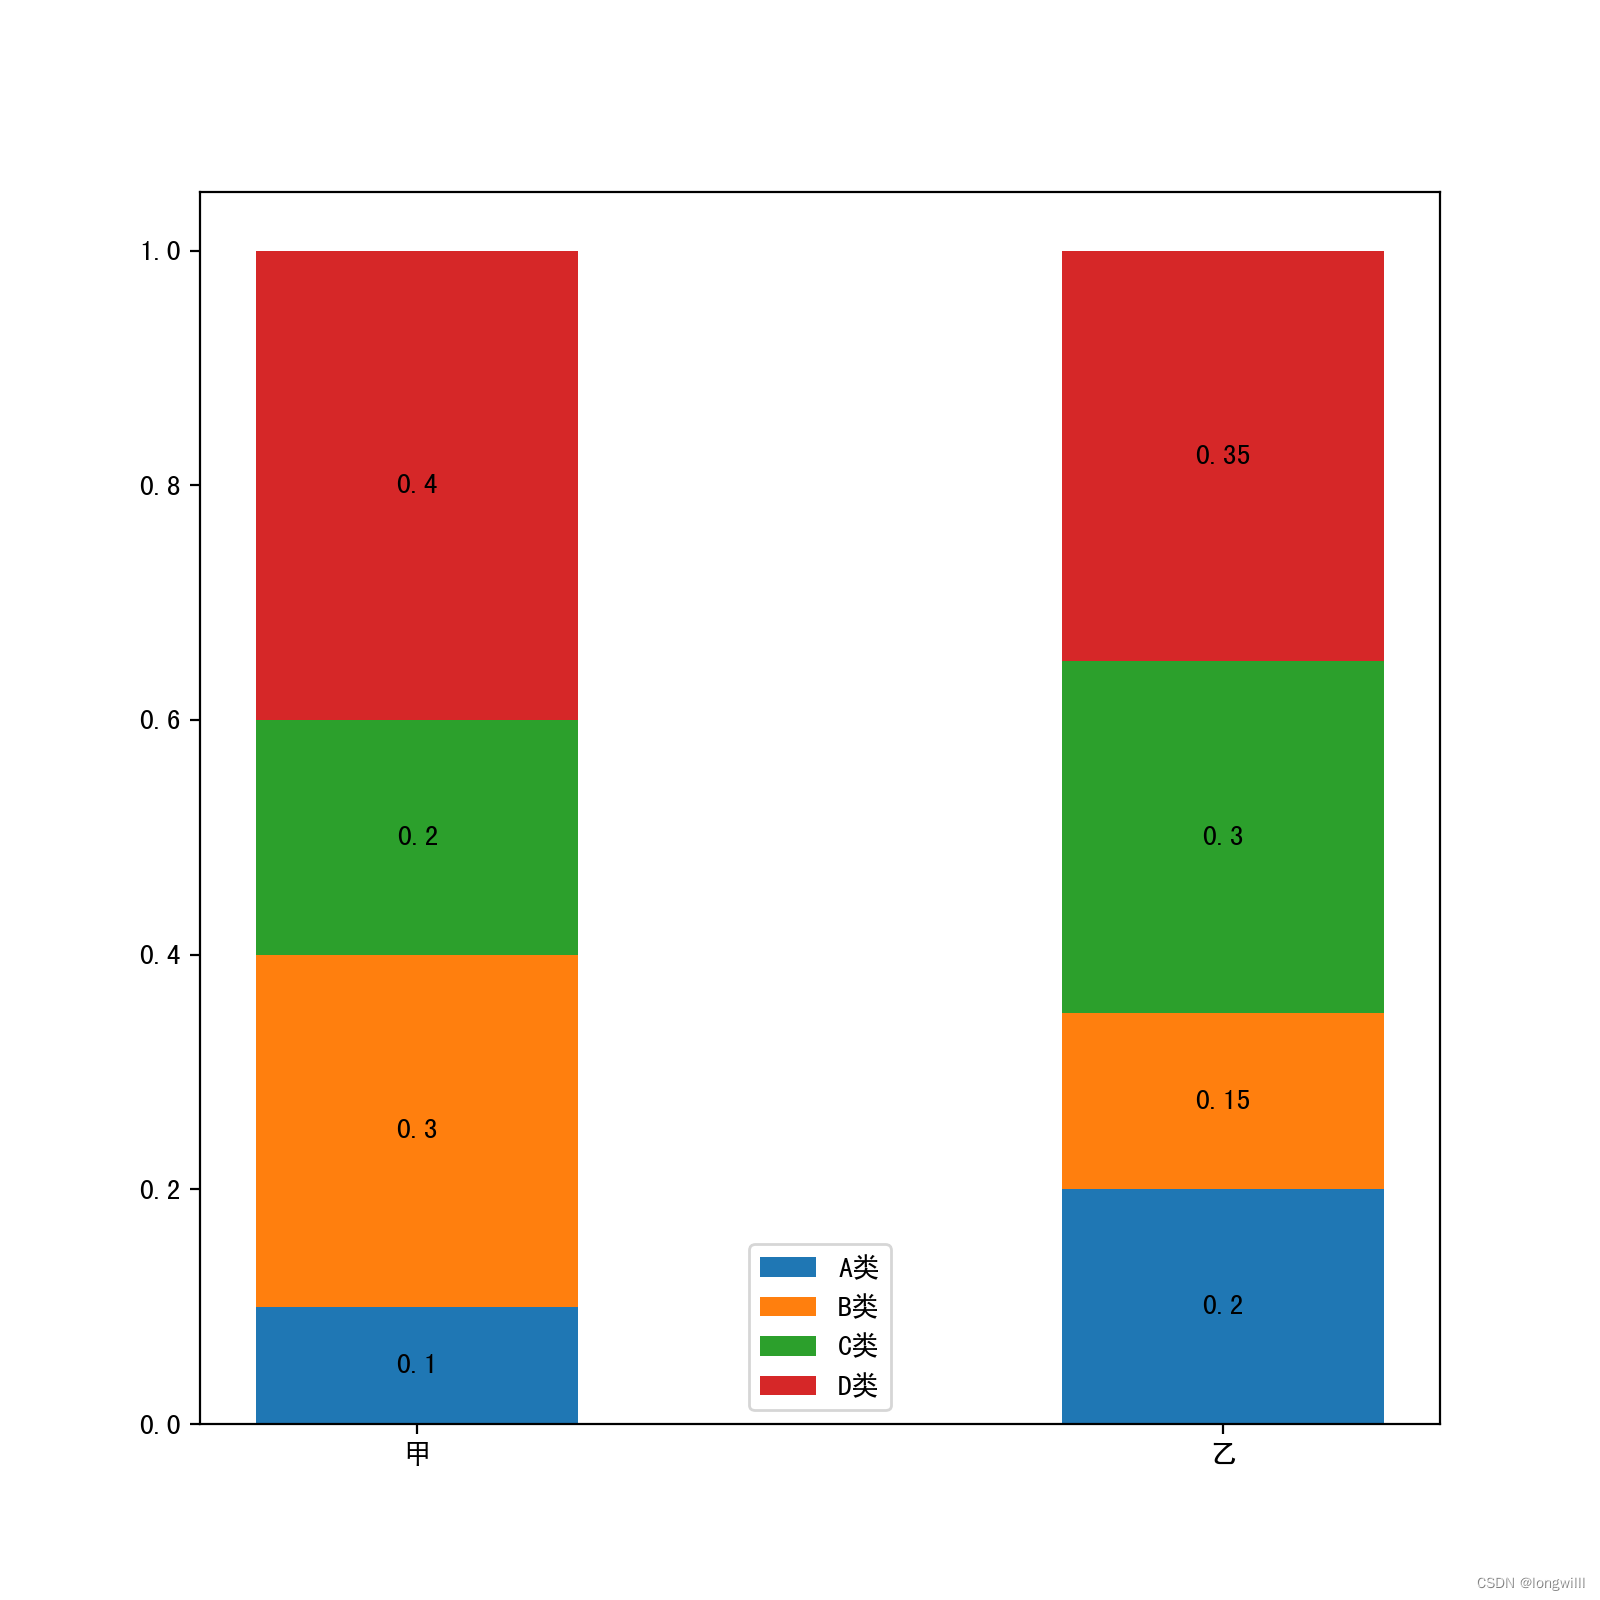
绘制堆积柱状图
import matplotlib.pyplot as plt
import numpy as np
import pandas as pd
fig, ax1 = plt.subplots(1, 1, figsize=(8, 8))

total = np.asarray([10000, 10000])
base = np.asarray([0, 0])
x_tick_name = ["甲", "乙"]
data = {
    'A类': [1000, 2000],
    'B类': [3000, 1500],
    'C类': [2000, 3000],
    'D类': [4000, 3500]
}

for v in sorted(list(data.keys())):
    item = data[v]
    item = np.asarray(item)

    item1 = item / total
    plt.bar([0, 0.5], item1, width=0.2, bottom=base, label=v)
    plt.text(0, base[0] + item1[0] - item1[0] / 2, item1[0], ha="center", va="center")
    plt.text(0.5, base[1] + item1[1] - item1[1] / 2, item1[1], ha="center", va="center")

    base = base + item1

plt.xticks([0, 0.5], x_tick_name)
plt.legend()

plt.tight_layout()
plt.savefig('test.png', dpi=300, bbox_inches='tight', pad_inches=0)
plt.show()
显示如下:
五、遇到的问题及解决办法
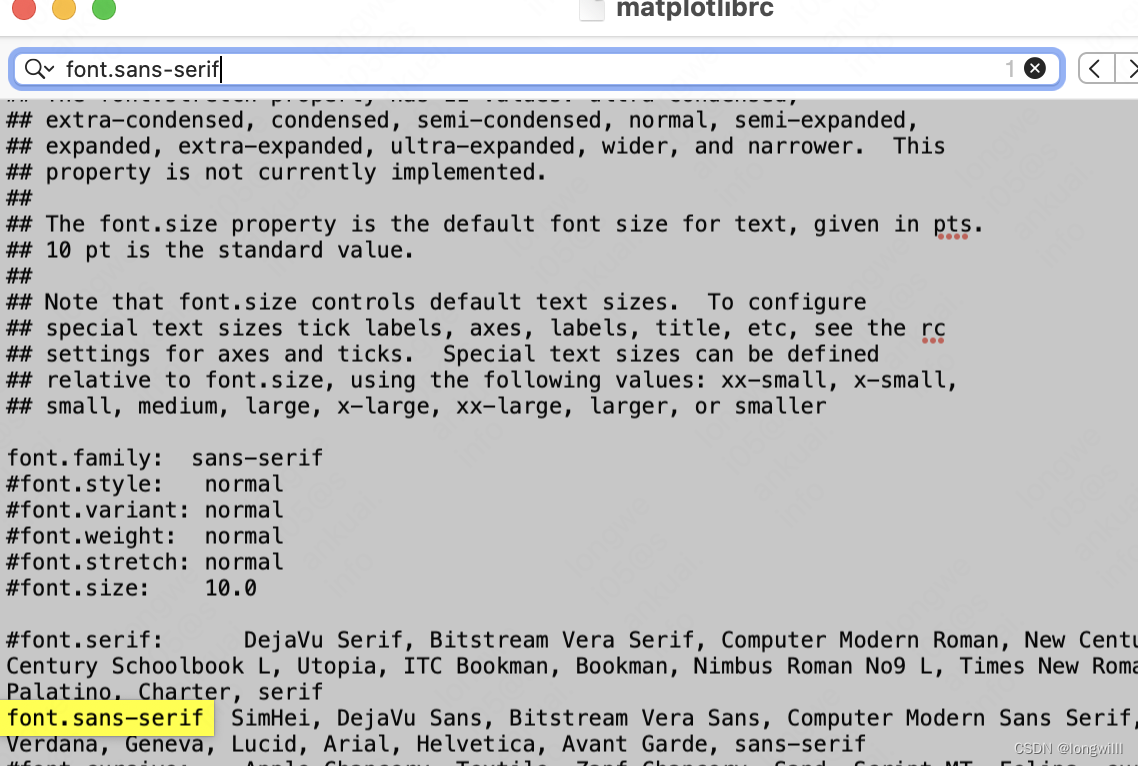
中文显示乱码
- 首先下载SimHei字体,网上搜一下,到处都是。
- 下载完之后,看下matplotlib库字体的存放路径
import matplotlib as plt
print(plt.get_data_path())
本人mac系统,输出路径如下:
/Users/lw/.virtualenvs/transformer/lib/python3.6/site-packages/matplotlib/mpl-data
进入到路径所示的文件夹,应该如下所示:
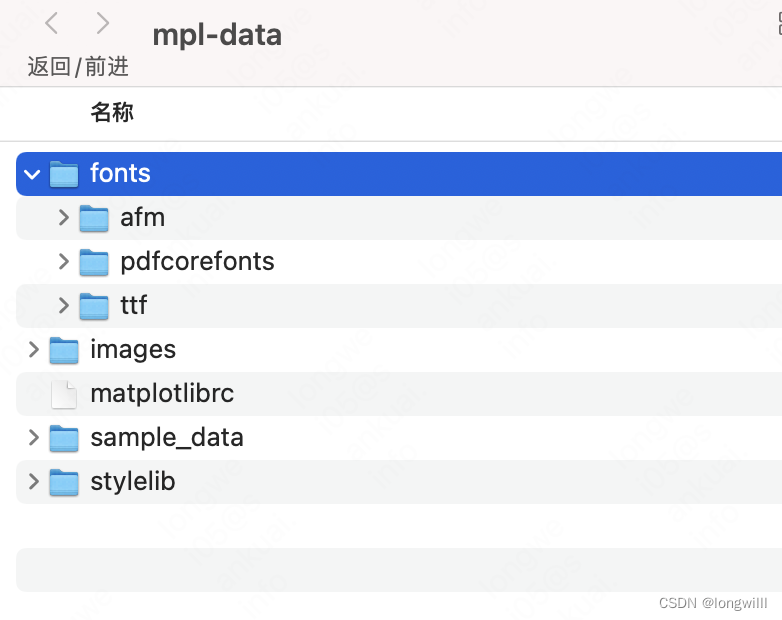
1. 将下载好的字体复制到fonts/ttf文件夹下;
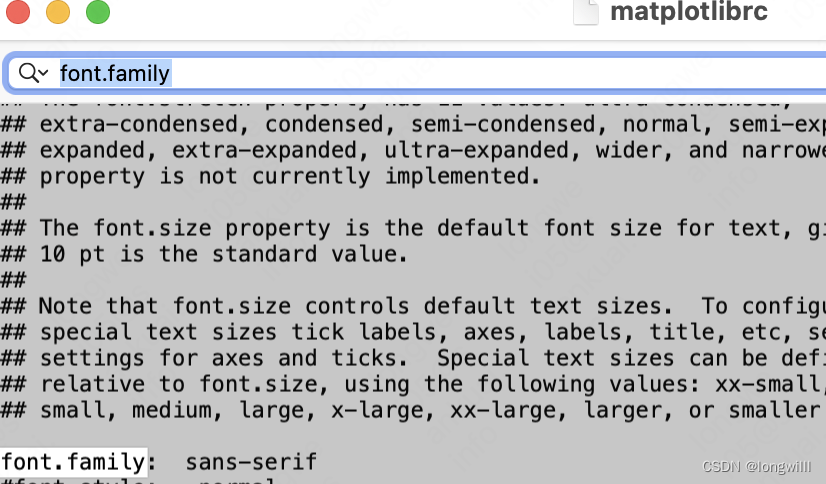
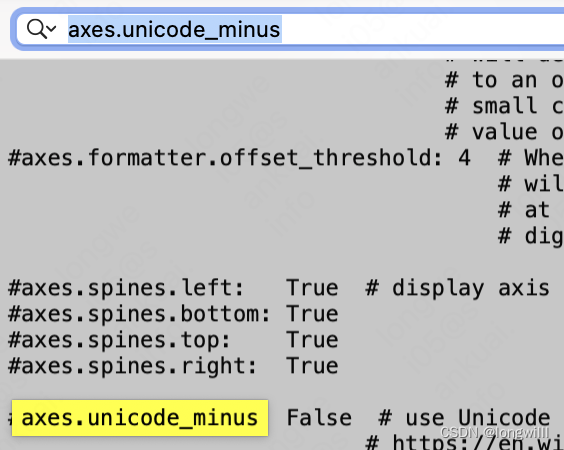
2. 修改matplotlibrc文件
共有三处需要修改,修改完之后的截图如下:
3. 刷新下配置
from matplotlib.font_manager import _rebuild
_rebuild() #reload一下
完成上面三步,应该就能正常显示中文了,如果还是不行,建议仔细检查下,重启IDE试试。
Original: https://blog.csdn.net/weixin_41558411/article/details/115582012
Author: longwilll
Title: python使用matplotlib绘图
原创文章受到原创版权保护。转载请注明出处:https://www.johngo689.com/763690/
转载文章受原作者版权保护。转载请注明原作者出处!