

Plotly没有为此类图表提供内置的矢量化,因为它可以很容易地由您自己完成,请参阅我基于您提供的链接的示例:import pandas as pd
import numpy as np
import plotly.offline as pyo
import plotly.graph_objs as go
Create a dataframe
value1 = np.random.uniform(size = 20)
value2 = value1 + np.random.uniform(size = 20) / 4
df = pd.DataFrame({‘group’:list(map(chr, range(65, 85))), ‘value1’:value1 , ‘value2’:value2 })
my_range=range(1,len(df.index)+1)
Add title and axis names
data1 = go.Scatter(
x=df[‘value1’],
y=np.array(my_range),
mode=’markers’,
marker=dict(color=’blue’)
)
data2 = go.Scatter(
x=df[‘value2’],
y=np.array(my_range),
mode=’markers’,
marker=dict(color=’green’)
)
Horizontal line shape
shapes=[dict(
type=’line’,
x0 = df[‘value1’].loc[i],
y0 = i + 1,
x1 = df[‘value2’].loc[i],
y1 = i + 1,
line = dict(
color = ‘grey’,
width = 2
)
) for i in range(len(df[‘value1’]))]
layout = go.Layout(
shapes = shapes,
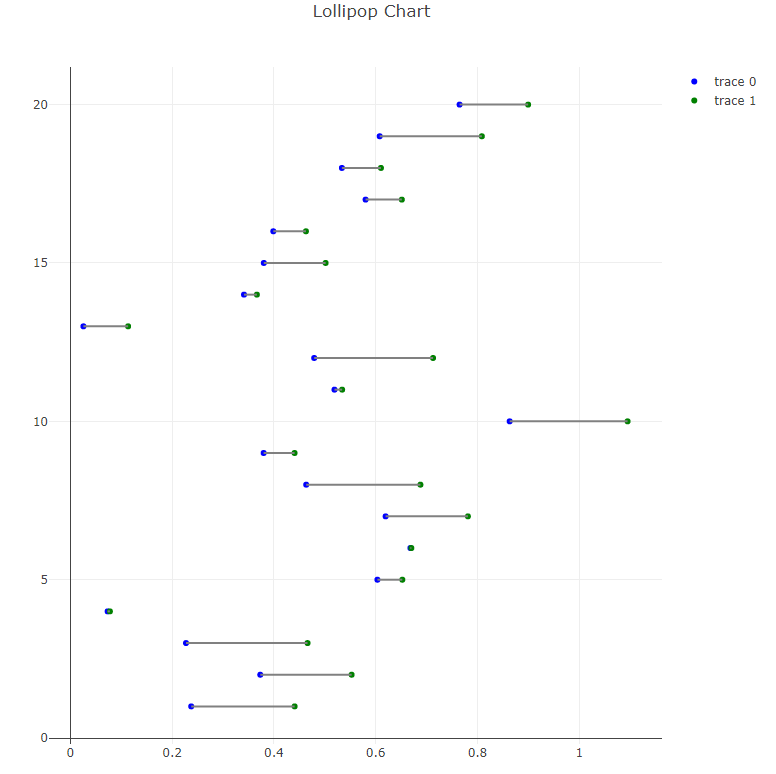
title=’Lollipop Chart’
)
Plot the chart
fig = go.Figure([data1, data2], layout)
pyo.plot(fig)
结果我得到了:

Original: https://blog.csdn.net/weixin_34072734/article/details/113507591
Author: 轻之文库
Title: python创建线段_在绘图图中添加线段的简洁方法(使用python/jupyter笔记本)?
原创文章受到原创版权保护。转载请注明出处:https://www.johngo689.com/755296/
转载文章受原作者版权保护。转载请注明原作者出处!