

Day5
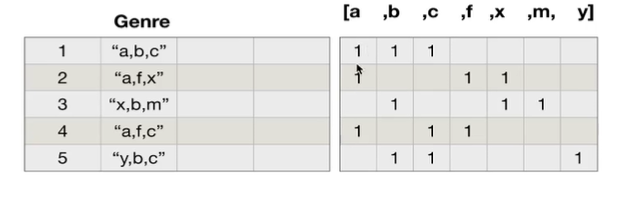
对于这一组电影数据,如果我们希望统计电影分类(genre)的情况,应该如何处理数据?
思路:重新构造一个全为0的数组,列名为分类,如果某一条数据中分类出现过,就让0变为1
set() 函数创建一个无序不重复元素集,可进行关系测试,删除重复数据,还可以计算交集、差集、并集等。
shape[0]表示行数,shape[1]表示列数


【操作】
#coding=utf-8
# 对于这一组电影数据,如果我们希望统计电影分类 (genre) 的情况
# 应该如何处理数据?
# 思路:重新构造一个全为 0 的数组,列名为分类,
# 如果某一条数据中分类出现过,就让 0 变为 1
import numpy as np
import pandas as pd
from matplotlib import pyplot as plt
file_path =”./IMDB-Movie-Data.csv”
df = pd.read_csv(file_path)
# print(df[“Genre”])
#—————————————————————— 重点 —————————————————————————————————————
# 统计分类的列表
# 列表嵌套列表的情况
#[[],[],[]]
temp_list = df[‘Genre’].str.split(“,”).tolist()
# set 创建一个无序不重复元素集
genre_list =list (set ([i for j in temp_list for i in j]))
# print(genre_list)
# 构造全为 0 的数组 ( 列为 genre_list 电影分类 )
zeros_df = pd.DataFrame(np.zeros((df.shape[0 ],len (genre_list))),columns =genre_list)
# print(zeros_df)
# 给每个电影出现分类的位置赋值 1
#shape[0] 为行数, shape[1] 为列数
for i in range (df.shape[0 ]):
#df.loc 通过标签(字符串)索引行数据
# 例: zeros_df.loc[0,[“Sci-fi”,”Mucical”]]=1
zeros_df.loc[i,temp_list[i]] =1
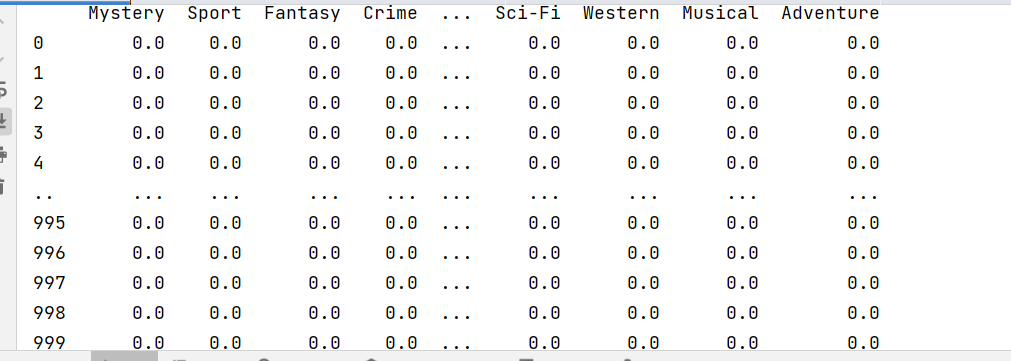
print (zeros_df)
# print(zeros_df.head(3))
# 统计每个分类的电影的数量和
genre_count = zeros_df.sum(axis =0 )
print (genre_count)
# 排序
genre_count = genre_count.sort_values()
#————————————————————————————————————————————————————————————————
x = genre_count.index
_y = genre_count.values
# _画图 ( 条形图)
plt.figure(figsize =(20 ,8 ),dpi =80 )
# 绘图
plt.bar(range (len (x)),_y)
#x_ 刻度
plt.xticks(range (len (_x)),_x)
plt.show()
结果:
Biography Thriller Horror Fantasy … Comedy Sport Animation Musical
0 0.0 0.0 0.0 0.0 … 0.0 0.0 0.0 0.0
1 0.0 0.0 0.0 0.0 … 0.0 0.0 0.0 0.0
2 0.0 1.0 1.0 0.0 … 0.0 0.0 0.0 0.0
3 0.0 0.0 0.0 0.0 … 1.0 0.0 1.0 0.0
4 0.0 0.0 0.0 1.0 … 0.0 0.0 0.0 0.0
.. … … … … … … … … …
995 0.0 0.0 0.0 0.0 … 0.0 0.0 0.0 0.0
996 0.0 0.0 1.0 0.0 … 0.0 0.0 0.0 0.0
997 0.0 0.0 0.0 0.0 … 0.0 0.0 0.0 0.0
998 0.0 0.0 0.0 0.0 … 1.0 0.0 0.0 0.0
999 0.0 0.0 0.0 1.0 … 1.0 0.0 0.0 0.0
[1000 rows x 20 columns]
Biography 81.0
Thriller 195.0
Horror 119.0
Fantasy 101.0
Mystery 106.0
Sci-Fi 120.0
Western 7.0
Family 51.0
History 29.0
Drama 513.0
Adventure 259.0
Action 303.0
Crime 150.0
War 13.0
Music 16.0
Romance 141.0
Comedy 279.0
Sport 18.0
Animation 49.0
Musical 5.0
dtype: float64

数据合并之join
join:默认情况下他是把行索引相同的数据合并到一起
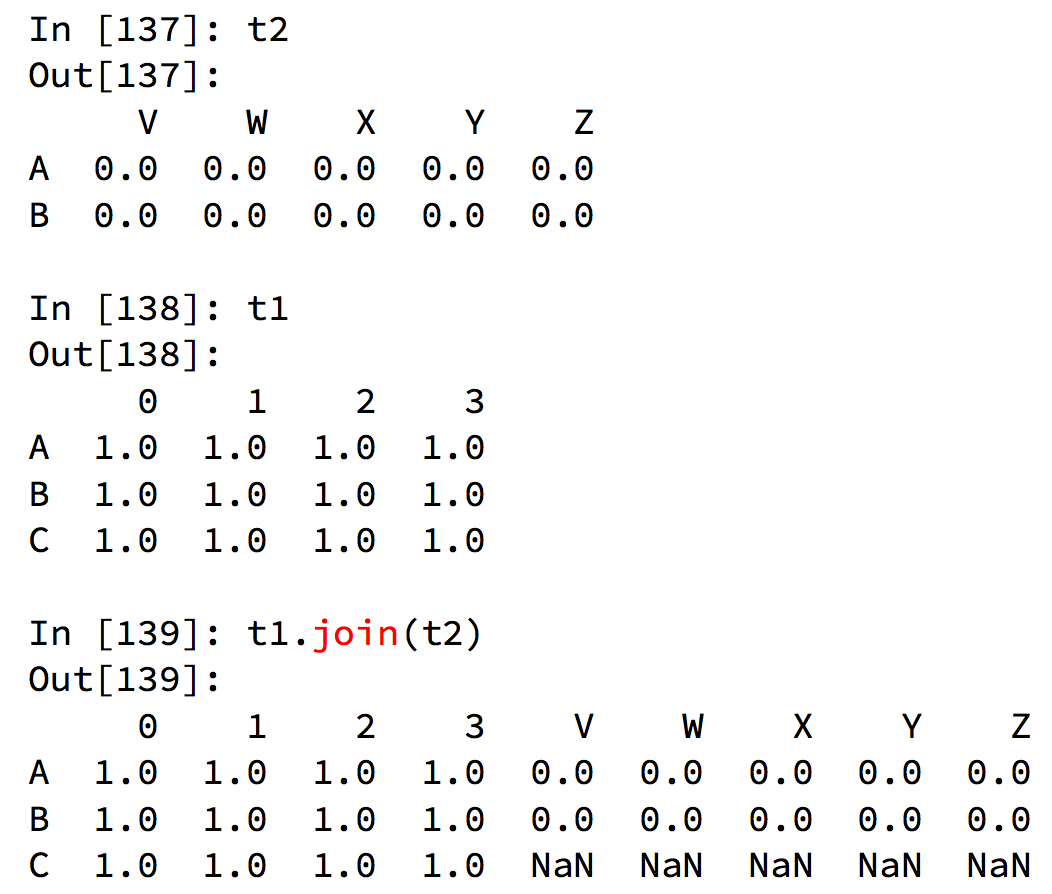
【示例】行索引相同数据(行索引分别为A,B和A,B,C)
#coding=utf-8
import pandas as pd
import numpy as np
t1 = pd.DataFrame(np.ones((2 ,4 )),columns =list (‘abcd’),index =[“A”,”B”])
print (t1)
t2 = pd.DataFrame(np.zeros((3 ,3 )),index =[“A”,”B”,”C”],columns =[“X”,”Y”,”Z”])
print (t2)
print (“t1.join(t2):\n “,t1.join(t2))
print (“t2.join(t1):\n “,t2.join(t1))
结果:
a b c d
A 1.0 1.0 1.0 1.0
B 1.0 1.0 1.0 1.0
X Y Z
A 0.0 0.0 0.0
B 0.0 0.0 0.0
C 0.0 0.0 0.0
t1.join(t2):
a b c d X Y Z
A 1.0 1.0 1.0 1.0 0.0 0.0 0.0
B 1.0 1.0 1.0 1.0 0.0 0.0 0.0
t2.join(t1):
X Y Z a b c d
A 0.0 0.0 0.0 1.0 1.0 1.0 1.0
B 0.0 0.0 0.0 1.0 1.0 1.0 1.0
C 0.0 0.0 0.0 NaN NaN NaN NaN
【示例】行索引数据不同(行索引分别为A,B和QWE)
#coding=utf-8
import pandas as pd
import numpy as np
t1 = pd.DataFrame(np.ones((2 ,4 )),columns =list (‘abcd’),index =[“A”,”B”])
print (t1)
t2 = pd.DataFrame(np.zeros((3 ,3 )),index =[“Q “,”W “,”E “],columns =[“X”,”Y”,”Z”])
print (t2)
print (“t1.join(t2):\n “,t1.join(t2))
print (“t2.join(t1):\n “,t2.join(t1))
结果:
a b c d
A 1.0 1.0 1.0 1.0
B 1.0 1.0 1.0 1.0
X Y Z
Q 0.0 0.0 0.0
W 0.0 0.0 0.0
E 0.0 0.0 0.0
t1.join(t2):
a b c d X Y Z
A 1.0 1.0 1.0 1.0 NaN NaN NaN
B 1.0 1.0 1.0 1.0 NaN NaN NaN
t2.join(t1):
X Y Z a b c d
Q 0.0 0.0 0.0 NaN NaN NaN NaN
W 0.0 0.0 0.0 NaN NaN NaN NaN
E 0.0 0.0 0.0 NaN NaN NaN NaN
数据合并之merge
merge:按照指定的列把数据按照一定的方式合并到一起
默认的合并方式inner,取交集
merge outer,并集,NaN补全
merge left,以左边为准,左边有几行就是几行,NaN补全
merge right,以右边为准,右边有几行就是几行,NaN补全
【操作】
# coding=utf-8
import pandas as pd
import numpy as np
t1 = pd.DataFrame(np.ones((2 ,4 )),columns =list (‘abcd’),index =[“A”,”B”])
t1.loc[“A”,”a”] =100
print (t1)
t3 = pd.DataFrame(np.arange(9 ).reshape((3 ,3 )),columns =list (“fax”))
print (t3)
# 内连接(只取 a 的交集部分)
print (“t1.merge 内连接\n “,t1.merge(t3,on =”a”)) #a 的交集只有 1 ,所以只合并一行
# 外连接
print (“t1.merge 外连接\n “,t1.merge(t3,on =”a”,how =”outer”))
# 左连接 ( 以 t1 为准 )
print (“t1.merge 左连接\n “,t1.merge(t3,on =”a”,how =”left”))
# 右连接(以 t3 为准)
print (“t1.merge 右连接\n “,t1.merge(t3,on =”a”,how =”right”))
结果:
a b c d
A 100.0 1.0 1.0 1.0
B 1.0 1.0 1.0 1.0
f a x
0 0 1 2
1 3 4 5
2 6 7 8
t1.merge内连接 #取并集,a为1时
a b c d f x
0 1.0 1.0 1.0 1.0 0 2
t1.merge外连接 #取交集,剩下nan补全
a b c d f x
0 100.0 1.0 1.0 1.0 NaN NaN
1 1.0 1.0 1.0 1.0 0.0 2.0
2 4.0 NaN NaN NaN 3.0 5.0
3 7.0 NaN NaN NaN 6.0 8.0
t1.merge左连接 #以左边为准
a b c d f x
0 100.0 1.0 1.0 1.0 NaN NaN
1 1.0 1.0 1.0 1.0 0.0 2.0
t1.merge右连接 #以右边为准
a b c d f x
0 1.0 1.0 1.0 1.0 0 2
1 4.0 NaN NaN NaN 3 5
2 7.0 NaN NaN NaN 6 8

现在我们有一组关于全球星巴克店铺的统计数据,如果我想知道美国的星巴克数量和中国的哪个多,或者我想知道中国每个省份星巴克的数量的情况,那么应该怎么办?
思路:遍历一遍,每次加1 ???
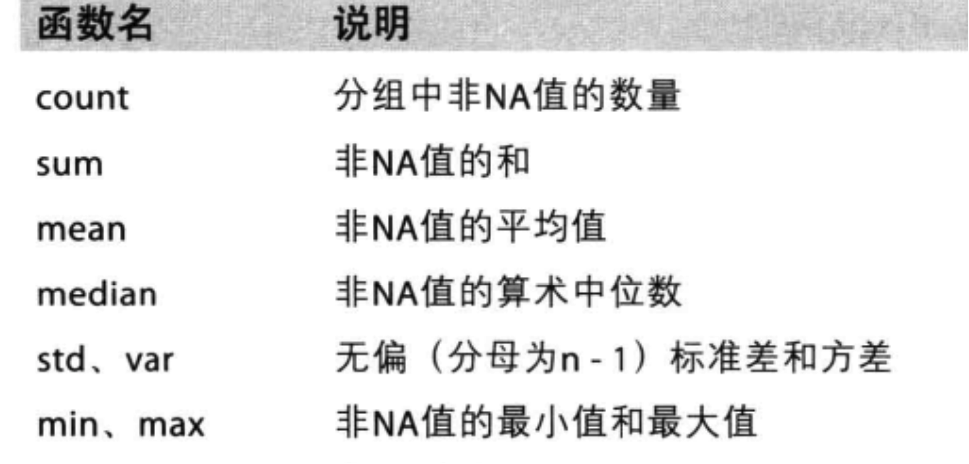
分组和聚合
在pandas中类似的分组的操作我们有很简单的方式来完成
df.groupby(by=”columns_name”)
那么问题来了,调用groupby方法之后返回的是什么内容?
grouped = df.groupby(by=”columns_name”)
grouped是一个DataFrameGroupBy对象,是可迭代的
grouped中的每一个元素是一个元组
元组里面是(索引(分组的值),分组之后的DataFrame)
那么,回到之前的问题:
要统计美国和中国的星巴克的数量,我们应该怎么做?
分组之后的每个DataFrame的长度?
长度是一个思路,但是我们有更多的方法(聚合方法)来解决这个问题
要统计美国和中国的星巴克的数量,我们应该怎么做?
【操作】中国和美国星巴克数量
#coding=utf-8
# 想知道美国的星巴克数量和中国的哪个多
# 或者我想知道中国每个省份星巴克的数量的情况
import pandas as pd
import numpy as np
file_path=”./starbucks_store_worldwide.csv”
df = pd.read_csv(file_path)
# print(df.head(1))
# print(df.info())
grouped = df.groupby(by =”Country”)
print (grouped)
#DataFrameGroupBy
# 可以遍历,
# for i,j in grouped:
# print(i)
# print(“-“10)
# print(j)
# print(‘*****’)
# df[df[“Country”]=”US”]
# 调用聚合方法
country_count = grouped[“Brand”].count()
print (“US:”,country_count[“US”])
print (“CN”,country_count[“CN”])
结果:
US: 13608
CN 2734
DataFrameGroupBy对象有很多经过优化的方法
如果我们需要对国家和省份进行分组统计,应该怎么操作呢?
【操作】
#coding=utf-8
import pandas as pd
import numpy as np
file_path=”./starbucks_store_worldwide.csv”
df = pd.read_csv(file_path)
china_data = df[df[“Country”]==”CN”]
grouped = china_data.groupby(by =”State/Province”).count()[“Brand”]
print (grouped)
结果:
State/Province
11 236
12 58
13 24
14 8
15 8
21 57
22 13
23 16
31 551
32 354
33 315
34 26
35 75
36 13
37 75
41 21
42 76
43 35
44 333
45 21
46 16
50 41
51 104
52 9
53 24
61 42
62 3
63 3
64 2
91 162
92 13
Name: Brand, dtype: int64
grouped = df.groupby(by=[df[“Country”],df[“State/Province”]])
很多时候我们只希望对获取分组之后的某一部分数据,或者说我们只希望对某几列数据进行分组,这个时候我们应该怎么办呢?
获取分组之后的某一部分数据:
df.groupby(by=[“Country”,”State/Province”])[“Country”].count()
【示例】
#coding=utf-8
import pandas as pd
import numpy as np
file_path=”./starbucks_store_worldwide.csv”
df = pd.read_csv(file_path)
# 数据按照多个条件进行分组,返回 series
grouped = df[“Brand”].groupby(by =[df[“Country”],df[“State/Province”]]).count()
print (grouped)
print (type (grouped)) # 有两个索引,只有最后一列是值
# 数据按照多个条件进行分组,返回 DataFrame
# grouped1 = df[“Brand”].groupby(by=[df[“Country”],df[“State/Province”]]).count()
# grouped2 = df.groupby(by=[df[“Country”],df[“State/Province”]])[[“Brand”]].count()
# grouped3 = df.groupby(by=[df[“Country”],df[“State/Province”]]).count()[[“Brand”]]
# print(grouped1,type(grouped1))
# print(‘*‘)
# print(grouped2,type(grouped2))
# print(‘***’)
# print(grouped3,type(grouped3))
结果:
Country State/Province
AD 7 1
AE AJ 2
AZ 48
DU 82
FU 2
..
US WV 25
WY 23
VN HN 6
SG 19
ZA GT 3
Name: Brand, Length: 545, dtype: int64
对某几列数据进行分组:
df[“Country”].groupby(by=[df[“Country”],df[“State/Province”]]).count()
观察结果,由于只选择了一列数据,所以结果是一个Series类型
如果我想返回一个DataFrame类型呢?
t1=df[[“Country”]].groupby(by=[df[“Country”],df[“State/Province”]]).count()
t2 = df.groupby(by=[“Country”,”State/Province”])[[“Country”]].count()
以上的两条命令结果一样
和之前的结果的区别在于当前返回的是一个DataFrame类型
那么问题来了:
和之前使用一个分组条件相比,当前的返回结果的前两列是什么?
是两个索引
索引和复合索引
简单的索引操作:
获取index:df.index
指定index :df.index = [‘x’,’y’]
重新设置index : df.reindex(list(“abcedf”))
指定某一列作为index :df.set_index(“Country”,drop=False)
返回index的唯一值:df.set_index(“Country”).index.unique()
【示例】
#coding=utf-8
import pandas as pd
import numpy as np
df1 = pd.DataFrame(np.ones((2 ,4 )),columns =[‘A’,’B’,’C’,’D’],index =[‘a’,’b’])
df2 = pd.DataFrame(np.ones((2 ,4 )),columns =[‘A’,’B’,’C’,’D’],index =[‘a’,’b’])
df1.loc[“a”,”A”] =100
df2.loc[“a”,”A”] =100
print (df1)
# 获取 index
print (df1.index)
# 指定 index
df1.index=[“x”,”y”]
print (df1)
# 重新设置 index
df3 = df2.reindex(list (‘af’))
print (df3)
# 指定某一列作为 index,drop=False 即列中不删除 A
print (df2.set_index(“A”,drop =False ))
# 返回 index 的唯一值
t= df1[“B”].unique
print (t)
# 转换为列表
print (list (df1.set_index(“A”).index))
结果:
A B C D
a 100.0 1.0 1.0 1.0
b 1.0 1.0 1.0 1.0
Index([‘a’, ‘b’], dtype=’object’)
A B C D
x 100.0 1.0 1.0 1.0
y 1.0 1.0 1.0 1.0
A B C D
a 100.0 1.0 1.0 1.0
f NaN NaN NaN NaN
A B C D
A
100.0 100.0 1.0 1.0 1.0
1.0 1.0 1.0 1.0 1.0
Original: https://blog.csdn.net/birdooo/article/details/122799111
Author: birdooo
Title: 机器学习 数据科学库Day5
原创文章受到原创版权保护。转载请注明出处:https://www.johngo689.com/739622/
转载文章受原作者版权保护。转载请注明原作者出处!