

这是机器未来的第53篇文章
原文首发地址:https://blog.csdn.net/RobotFutures/article/details/126752099


; 《Python数据科学快速入门系列》快速导航:
- 【Python数据科学快速入门系列 | 01】Numpy初窥——基础概念
- 【Python数据科学快速入门系列 | 02】创建ndarray对象的十多种方法
- 【Python数据科学快速入门系列 | 03】玩转数据摘取:Numpy的索引与切片
- 【Python数据科学快速入门系列 | 04】Numpy四则运算、矩阵运算和广播机制的爱恨情仇
- 【Python数据科学快速入门系列 | 05】常用科学计算函数
- 【Python数据科学快速入门系列 | 06】Matplotlib数据可视化基础入门(一)
- 【Python数据科学快速入门系列 | 07】Matplotlib数据可视化基础入门(二)
文章目录
写在开始:
- 博客简介:专注AIoT领域,追逐未来时代的脉搏,记录路途中的技术成长!
- 博主社区:AIoT机器智能, 欢迎加入!
- 专栏简介:从0到1掌握数据科学常用库Numpy、Matploblib、Pandas。
- 面向人群:AI初级学习者
接上一篇文章:【Python数据科学快速入门系列 | 06】Matplotlib数据可视化基础入门(一)
前言
本文概述了matplotlib是什么,能做什么,怎么做的问题,是一篇matplotlib数据可视化入门文章,对于matplotlib的基础功能做了一个整体的使用说明。包含图例、轴标签、绘图区域的标签、轴的刻度、轴的范围,cmap颜色图谱映射以及注释等内容。
- Matplotlib的基础使用
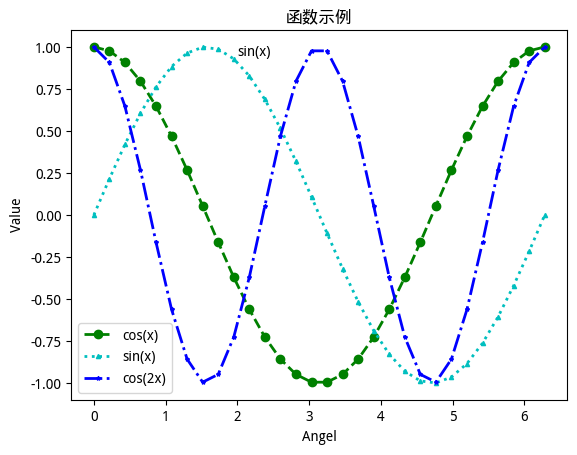
3.2.5 添加图例标签
在同一个绘图区域内存在多个图表时,容易混淆看不清每个图标具体标识什么类型的数据,可以设置图例来标识来区分。
import matplotlib as mpl
import matplotlib.pyplot as plt
import numpy as np

x = np.linspace(0, 2*np.pi, 30)
y1 = np.cos(x)
y2 = np.sin(x)
y3 = np.cos(2*x)

fig, ax = plt.subplots()

ax.plot(x, y1, 'go--', linewidth=2, markersize=6, label="cos(x)")

ax.plot(x, y2, 'c^:', linewidth=2, markersize=3, label="sin(x)")

ax.plot(x, y3, 'b*-.', linewidth=2, markersize=3, label="cos(2x)")

ax.legend(loc='upper right')
<matplotlib.legend.legend at 0x7fd1e0801af0>
</matplotlib.legend.legend>
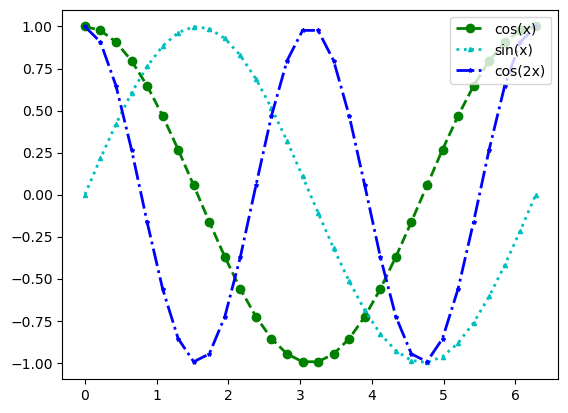
可以看到在右上角新增了图例区域,指定了曲线的数据函数名称。
可支持的位置配置如下:
Location StringLocation Code’best’0’upper right’1’upper left’2’lower left’3’lower right’4’right’5’center left’6’center right’7’lower center’8’upper center’9’center’10
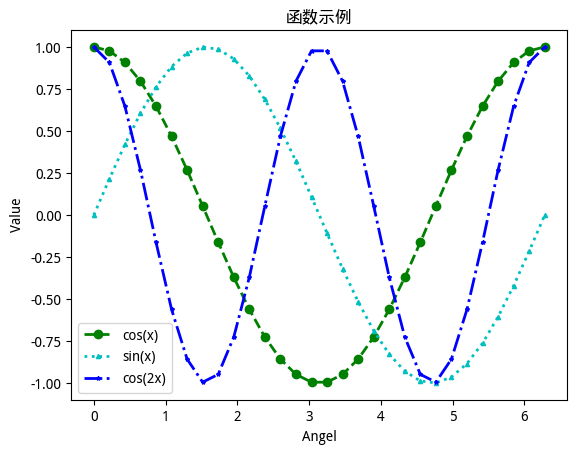
3.2.6 设置轴的标签和图的标题
ax.set_xlable - 设置X轴标签
ax.set_ylabel - 设置Y轴标签
ax.set_title  - 设置绘图区域的标题,如果要支持中文,需要做如下配置:
plt.rcParams["font.sans-serif"]=["SimHei"]
import matplotlib as mpl
import matplotlib.pyplot as plt
import numpy as np

plt.rcParams["font.sans-serif"]=["WenQuanYi Micro Hei"]
plt.rcParams["axes.unicode_minus"]=False

x = np.linspace(0, 2*np.pi, 30)
y1 = np.cos(x)
y2 = np.sin(x)
y3 = np.cos(2*x)
y4 = np.sin(2*x)

fig, ax = plt.subplots()

ax.plot(x, y1, 'go--', linewidth=2, markersize=6, label="cos(x)")

ax.plot(x, y2, 'c^:', linewidth=2, markersize=3, label="sin(x)")

ax.plot(x, y3, 'b*-.', linewidth=2, markersize=3, label="cos(2x)")

ax.set_xlabel("Angel")

ax.set_ylabel("Value")

ax.set_title("函数示例")

ax.legend(loc='best')
<matplotlib.legend.legend at 0x7fd1e07e5ee0>
</matplotlib.legend.legend>
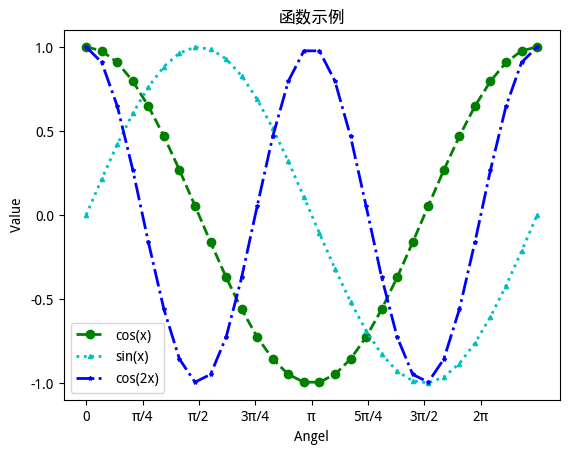
3.2.7 设置轴的刻度值
ticks指定自定义的浮点类型的刻度标签列表
labels指定自定义的字符串格式的刻度标签列表,与ticks刻度值相对应,可选
mininor默认值为False,开启后,默认刻度标签和自定义刻度标签都会启用
ax.set_xticks(ticks, labels, minior=False)
ax.set_yticks(ticks, labels, minior=False)
import matplotlib as mpl
import matplotlib.pyplot as plt
import numpy as np

plt.rcParams["font.sans-serif"]=["WenQuanYi Micro Hei"]
plt.rcParams["axes.unicode_minus"]=False

x = np.linspace(0, 2*np.pi, 30)
y1 = np.cos(x)
y2 = np.sin(x)
y3 = np.cos(2*x)
y4 = np.sin(2*x)

fig, ax = plt.subplots()

ax.plot(x, y1, 'go--', linewidth=2, markersize=6, label="cos(x)")

ax.plot(x, y2, 'c^:', linewidth=2, markersize=3, label="sin(x)")

ax.plot(x, y3, 'b*-.', linewidth=2, markersize=3, label="cos(2x)")

ax.set_xlabel("Angel")

ax.set_ylabel("Value")

ax.set_title("函数示例")

ax.legend(loc='best')

ax.set_xticks(ticks=np.arange(0, 2*np.pi, np.pi/4), labels=[0, 'π/4', 'π/2', '3π/4', 'π', '5π/4', '3π/2', '2π'])

ax.set_yticks(ticks=[-1.0, -0.5, 0, 0.5, 1])
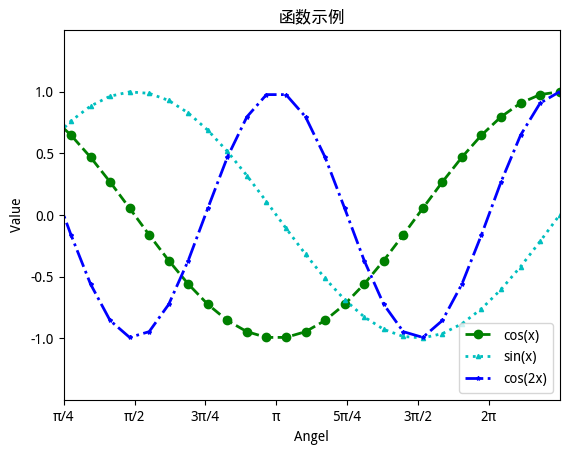
3.2.8 设置坐标轴的范围
3.2.8.1 set_xlim和set_ylim
ax.set_ylim(bottom, top)
ax.set_xlim(left, right)
3.2.8.2 ax.set方法
ax.set(xlim=(xmin, xmax), ylim=(ymin, ymax))
3.2.8.3 ax.axis方法
ax.axis(xmin, xmax, ymin, ymax)
或
plt.axis(xmin, xmax, ymin, ymax)
import matplotlib as mpl
import matplotlib.pyplot as plt
import numpy as np

plt.rcParams["font.sans-serif"]=["WenQuanYi Micro Hei"]
plt.rcParams["axes.unicode_minus"]=False

x = np.linspace(0, 2*np.pi, 30)
y1 = np.cos(x)
y2 = np.sin(x)
y3 = np.cos(2*x)
y4 = np.sin(2*x)

fig, ax = plt.subplots()

ax.plot(x, y1, 'go--', linewidth=2, markersize=6, label="cos(x)")

ax.plot(x, y2, 'c^:', linewidth=2, markersize=3, label="sin(x)")

ax.plot(x, y3, 'b*-.', linewidth=2, markersize=3, label="cos(2x)")

ax.set_xlabel("Angel")

ax.set_ylabel("Value")

ax.set_title("函数示例")

ax.legend(loc='best')

ax.set_xticks(ticks=np.arange(0, 2*np.pi, np.pi/4), labels=[0, 'π/4', 'π/2', '3π/4', 'π', '5π/4', '3π/2', '2π'])

ax.set_yticks(ticks=[-1.0, -0.5, 0, 0.5, 1])

ax.set(xlim=(np.pi/4, np.pi*2), ylim=(-1.5, 1.5))
(0.7853981633974483, 6.283185307179586, -1.5, 1.5)
3.2.9 颜色图谱映射
2D平面图表一般数据输入是2个维度,X,Y,有时候我们需要体现3个维度,这个时候我们会将第3个维度体现在颜色上。
例如,我们现在需要做鸢尾花数据集中花萼长度和花萼宽度与鸢尾花分类的相关性分析,现在数据其实就有3个维度,花萼长度、花萼宽度、鸢尾花分类。而我们的2D图表又仅能表示2维的关系。
有个办法就是将鸢尾花分类这个维度体现在颜色上,默认情况下,颜色我们仅配置一个颜色代码,如果鸢尾花的分类具有多个分类,那么应该用不同的颜色来标识,这个时候就需要用到颜色图谱映射功能cmap。
以鸢尾花数据集中花萼长度和花萼宽度与鸢尾花分类的相关性分析为例。
import numpy as np

data = []
column_name = []
with open(file='iris.txt',mode='r') as f:

    line = f.readline()
    if line:
        column_name = np.array(line.strip().split(','))

    while True:
        line = f.readline()
        if line:
            data.append(line.strip().split(','))
        else:
            break

data = np.array(data,dtype=float)

X_data = data[:, :4]

y_data = data[:, -1]

print(data.shape, X_data.shape, y_data.shape)

plt.scatter(X_data[:,0], X_data[:,1], c=y_data, cmap='brg_r', s=10)
(150, 5) (150, 4) (150,)

<matplotlib.collections.pathcollection at 0x7fd1d69551f0>
</matplotlib.collections.pathcollection>
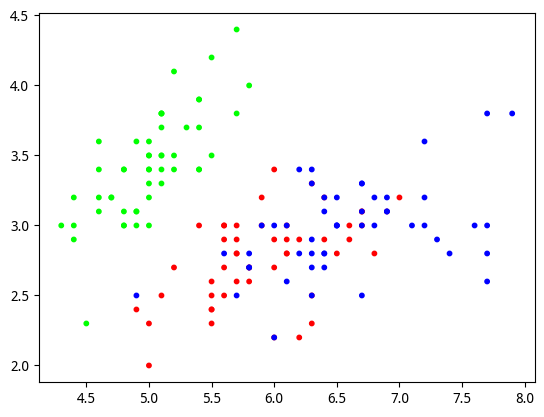
这样就非常直观地将2种特征和标签的相关性体现出来了。
cmap支持的颜色图谱非常多,有以下两种方式获得颜色图谱代码:
- 从官网查询可视化的颜色代码
https://matplotlib.org/stable/gallery/color/colormap_reference.html
- 根据代码获取
import matplotlib as mpl
print(mpl.colormaps)
ColormapRegistry; available colormaps:
'magma', 'inferno', 'plasma', 'viridis', 'cividis', 'twilight', 'twilight_shifted', 'turbo', 'Blues', 'BrBG', 'BuGn', 'BuPu', 'CMRmap', 'GnBu', 'Greens', 'Greys', 'OrRd', 'Oranges', 'PRGn', 'PiYG', 'PuBu', 'PuBuGn', 'PuOr', 'PuRd', 'Purples', 'RdBu', 'RdGy', 'RdPu', 'RdYlBu', 'RdYlGn', 'Reds', 'Spectral', 'Wistia', 'YlGn', 'YlGnBu', 'YlOrBr', 'YlOrRd', 'afmhot', 'autumn', 'binary', 'bone', 'brg', 'bwr', 'cool', 'coolwarm', 'copper', 'cubehelix', 'flag', 'gist_earth', 'gist_gray', 'gist_heat', 'gist_ncar', 'gist_rainbow', 'gist_stern', 'gist_yarg', 'gnuplot', 'gnuplot2', 'gray', 'hot', 'hsv', 'jet', 'nipy_spectral', 'ocean', 'pink', 'prism', 'rainbow', 'seismic', 'spring', 'summer', 'terrain', 'winter', 'Accent', 'Dark2', 'Paired', 'Pastel1', 'Pastel2', 'Set1', 'Set2', 'Set3', 'tab10', 'tab20', 'tab20b', 'tab20c', 'magma_r', 'inferno_r', 'plasma_r', 'viridis_r', 'cividis_r', 'twilight_r', 'twilight_shifted_r', 'turbo_r', 'Blues_r', 'BrBG_r', 'BuGn_r', 'BuPu_r', 'CMRmap_r', 'GnBu_r', 'Greens_r', 'Greys_r', 'OrRd_r', 'Oranges_r', 'PRGn_r', 'PiYG_r', 'PuBu_r', 'PuBuGn_r', 'PuOr_r', 'PuRd_r', 'Purples_r', 'RdBu_r', 'RdGy_r', 'RdPu_r', 'RdYlBu_r', 'RdYlGn_r', 'Reds_r', 'Spectral_r', 'Wistia_r', 'YlGn_r', 'YlGnBu_r', 'YlOrBr_r', 'YlOrRd_r', 'afmhot_r', 'autumn_r', 'binary_r', 'bone_r', 'brg_r', 'bwr_r', 'cool_r', 'coolwarm_r', 'copper_r', 'cubehelix_r', 'flag_r', 'gist_earth_r', 'gist_gray_r', 'gist_heat_r', 'gist_ncar_r', 'gist_rainbow_r', 'gist_stern_r', 'gist_yarg_r', 'gnuplot_r', 'gnuplot2_r', 'gray_r', 'hot_r', 'hsv_r', 'jet_r', 'nipy_spectral_r', 'ocean_r', 'pink_r', 'prism_r', 'rainbow_r', 'seismic_r', 'spring_r', 'summer_r', 'terrain_r', 'winter_r', 'Accent_r', 'Dark2_r', 'Paired_r', 'Pastel1_r', 'Pastel2_r', 'Set1_r', 'Set2_r', 'Set3_r', 'tab10_r', 'tab20_r', 'tab20b_r', 'tab20c_r'
3.2.10 添加注释
3.2.10.1 文本注释
可以在绘图区域的任意指定坐标显示注释, 注释支持Latex公式
x,y 坐标
s   注释
ax.text(x, y, s, fontdict=None, **kwargs)
import matplotlib as mpl
import matplotlib.pyplot as plt
import numpy as np

plt.rcParams["font.sans-serif"]=["WenQuanYi Micro Hei"]
plt.rcParams["axes.unicode_minus"]=False

fig, ax = plt.subplots()

ax.plot(x, y1, 'go--', linewidth=2, markersize=6, label="cos(x)")

ax.plot(x, y2, 'c^:', linewidth=2, markersize=3, label="sin(x)")

ax.plot(x, y3, 'b*-.', linewidth=2, markersize=3, label="cos(2x)")

ax.set_xlabel("Angel")

ax.set_ylabel("Value")

ax.set_title("函数示例")

ax.legend(loc='best')

ax.text(2, 0.95, "sin(x)")

plt.show()
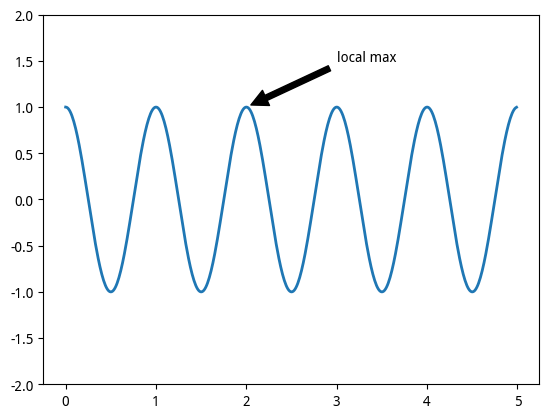
3.2.10.2 箭头文本注释
xy, 箭头坐标
xytext,文本坐标
arrowprops,箭头样式
ax.annotate('local max', xy=(2.5, 1), xytext=(3, 1.5),
            arrowprops=dict(facecolor='black', shrink=0.05))
fig, ax = plt.subplots()

t = np.arange(0.0, 5.0, 0.01)
s = np.cos(2 * np.pi * t)
line, = ax.plot(t, s, lw=2)

ax.annotate('local max', xy=(2.0, 1), xytext=(3, 1.5),
            arrowprops=dict(facecolor='black', shrink=0.05))

ax.set_ylim(-2, 2)
(-2.0, 2.0)
- 总结
本文总结了matplotlib基础的语法及用法,包含了安装、图的绘制、绘图样式,X、Y轴标签、图的标题、图例、注释等描述,更多高级功能详情访问matplotlib.org。
扩展思考:
matplotlib的适用边界在哪里?在哪些场景不适合用matplotlib,你知道吗?请在评论区写出你的答案。
参考文献
— 博主热门专栏推荐 —
- Python零基础快速入门系列
- 深入浅出i.MX8企业级开发实战系列
- MQTT从入门到提高系列
- 物体检测快速入门系列
- 自动驾驶模拟器AirSim快速入门
- 安全利器SELinux入门系列
- Python数据科学快速入门系列

Original: https://blog.csdn.net/RobotFutures/article/details/126900121
Author: 机器未来
Title: 【Python数据科学快速入门系列 | 07】Matplotlib数据可视化基础入门(二)
原创文章受到原创版权保护。转载请注明出处:https://www.johngo689.com/730887/
转载文章受原作者版权保护。转载请注明原作者出处!