

SHAP有两个核心,分别是shap values和shap interaction values,在官方的应用中,主要有三种,分别是force plot、summary plot和dependence plot,这三种应用都是对shap values和shap interaction values进行处理后得到的。
代码实现
a waterfall plot
def waterfall(shap_values, max_display=10, show=True):
    """ Plots an explantion of a single prediction as a waterfall plot.

    The SHAP value of a feature represents the impact of the evidence provided by that feature on the model's
    output. The waterfall plot is designed to visually display how the SHAP values (evidence) of each feature
    move the model output from our prior expectation under the background data distribution, to the final model
    prediction given the evidence of all the features. Features are sorted by the magnitude of their SHAP values
    with the smallest magnitude features grouped together at the bottom of the plot when the number of features
    in the models exceeds the max_display parameter.

    Parameters
    ----------
    shap_values : Explanation
        A one-dimensional Explanation object that contains the feature values and SHAP values to plot.

    max_display : str
        The maximum number of features to plot.

    show : bool
        Whether matplotlib.pyplot.show() is called before returning. Setting this to False allows the plot
        to be customized further after it has been created.

"""
shap.summary_plot
取每个特征的SHAP值的绝对值的平均值作为该特征的重要性,得到一个标准的条形图(multi-class则生成堆叠的条形图)
shap.summary_plot(shap_values, features=None, feature_names=None, max_display=None, plot_type=None, color=None, axis_color='#333333', title=None, alpha=1, show=True, sort=True, color_bar=True, plot_size='auto', layered_violin_max_num_bins=20, class_names=None, class_inds=None, color_bar_label='Feature value', cmap=<matplotlib.colors.LinearSegmentedColormap object>, auto_size_plot=None, use_log_scale=False)
Create a SHAP beeswarm plot, colored by feature values when they are provided.
Parameters
shap_valuesnumpy.array
For single output explanations this is a matrix of SHAP values (# samples x # features). For multi-output explanations this is a list of such matrices of SHAP values.
featuresnumpy.array or pandas.DataFrame or list
Matrix of feature values (# samples x # features) or a feature_names list as shorthand
feature_nameslist
Names of the features (length # features)
max_display:int
How many top features to include in the plot (default is 20, or 7 for interaction plots)
plot_type”dot” (default for single output), “bar” (default formulti-output), “violin”,
or “compact_dot”. What type of summary plot to produce. Note that “compact_dot” is only used for SHAP interaction values.
plot_size”auto” (default), float, (float, float), or None
What size to make the plot. By default the size is auto-scaled based on the number of features that are being displayed. Passing a single float will cause each row to be that many inches high. Passing a pair of floats will scale the plot by that number of inches. If None is passed then the size of the current figure will be left unchanged.
shap.force_plot
shap.force_plot(base_value, shap_values=None, features=None, feature_names=None, out_names=None, link='identity', plot_cmap='RdBu', matplotlib=False, show=True, figsize=20, 3, ordering_keys=None, ordering_keys_time_format=None, text_rotation=0)
Visualize the given SHAP values with an additive force layout.
Parameters
base_value:float
This is the reference value that the feature contributions start from. For SHAP values it should be the value of explainer.expected_value.
shap_values:numpy.array
Matrix of SHAP values (# features) or (# samples x # features). If this is a 1D array then a single force plot will be drawn, if it is a 2D array then a stacked force plot will be drawn.
features:numpy.array
Matrix of feature values (# features) or (# samples x # features). This provides the values of all the features, and should be the same shape as the shap_values argument.
feature_names:list
List of feature names (# features).
out_names:str
The name of the output of the model (plural to support multi-output plotting in the future).
link”identity” or “logit”
The transformation used when drawing the tick mark labels. Using logit will change log-odds numbers into probabilities.
matplotlib:bool
Whether to use the default Javascript output, or the (less developed) matplotlib output. Using matplotlib can be helpful in scenarios where rendering Javascript/HTML is inconvenient.
shap_values
def shap_values(self, X, ranked_outputs=None, output_rank_order='max', check_additivity=True):
Return approximate SHAP values for the model applied to the data given by X.
Parameters
    X : list,
        if framework == 'tensorflow': numpy.array, or pandas.DataFrame
        if framework == 'pytorch': torch.tensor
        A tensor (or list of tensors) of samples (where X.shape[0] == # samples) on which to
        explain the model's output.

    ranked_outputs : None or int
        If ranked_outputs is None then we explain all the outputs in a multi-output model. If
        ranked_outputs is a positive integer then we only explain that many of the top model
        outputs (where "top" is determined by output_rank_order). Note that this causes a pair
        of values to be returned (shap_values, indexes), where shap_values is a list of numpy
        arrays for each of the output ranks, and indexes is a matrix that indicates for each sample
        which output indexes were choses as "top".

    output_rank_order : "max", "min", or "max_abs"
        How to order the model outputs when using ranked_outputs, either by maximum, minimum, or
        maximum absolute value.

    Returns
    -------
    array or list
        For a models with a single output this returns a tensor of SHAP values with the same shape
        as X. For a model with multiple outputs this returns a list of SHAP value tensors, each of
        which are the same shape as X. If ranked_outputs is None then this list of tensors matches
        the number of model outputs. If ranked_outputs is a positive integer a pair is returned
        (shap_values, indexes), where shap_values is a list of tensors with a length of
        ranked_outputs, and indexes is a matrix that indicates for each sample which output indexes
        were chosen as "top".

"""
    return self.explainer.shap_values(X, ranked_outputs, output_rank_order, check_additivity=check_additivity)
SHAP Decision Plots
https://slundberg.github.io/shap/notebooks/plots/decision_plot.html
图类型
Feature Importance:
之前提到传统的importance的计算方法效果不好,SHAP提供了另一种计算特征重要性的思路。
取每个特征的SHAP值的绝对值的平均值作为该特征的重要性,得到一个标准的条形图(multi-class则生成堆叠的条形图)
shap.summary_plot(shap_values, X, plot_type=”bar”)
摘要图
summary plot 为每个样本绘制其每个特征的SHAP值,这可以更好地理解整体模式,并允许发现预测异常值。每一行代表一个特征,横坐标为SHAP值。一个点代表一个样本,颜色表示特征值(红色高,蓝色低)。比如,这张图表明LSTAT特征较高的取值会降低预测的房价
结合了特征重要度和特征的影响。摘要图上的每个点都是一个特征和一个实例的Shapley值,y轴上的位置由特征决定,x轴上的位置由Shapley值决定,颜色代表特征值从小到大,重叠点在y轴方向上抖动,因此我们可以了解每个特征的Shapley值的分布。
对特征的总体分析
除了能对单个样本的SHAP值进行可视化之外,还能对特征进行整体的可视化。
下图中每一行代表一个特征,横坐标为SHAP值。一个点代表一个样本,颜色越红说明特征本身数值越大,颜色越蓝说明特征本身数值越小。
我们可以直观地看出潜力potential是一个很重要的特征,而且基本上是与身价成正相关的。年龄age也会明显影响身价,蓝色点主要集中在SHAP小于0的区域,可见年纪小会降低身价估值,另一方面如果年纪很大,也会降低估值,甚至降低得更明显,因为age这一行最左端的点基本上都是红色的。
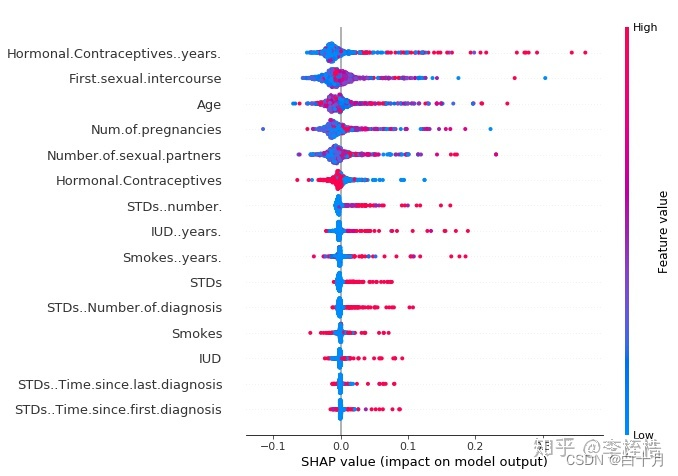

SHAP摘要图显示服用激素避孕药的年数(Hormonal.Contraceptives…years.)越少,患癌症的风险越低,服用年数越多,患癌症的风险越高。不过所有的影响都只是描述了模型的行为,在现实世界中不一定是因果关系。
在摘要图中,我们首先看到特征值与预测影响之间的关系,但要了解这种关系的确切形式,我们必须看看SHAP依赖图。
; SHAP依赖图
官网文档
https://shap-lrjball.readthedocs.io/en/latest/generated/shap.dependence_plot.html
SHAP依赖图可能是最简单的全局解释图:
选择一个特性。对于每个数据实例,绘制一个点,x轴上是特征值,y轴上是对应的Shapley值。
完成。
下图显示了服用激素避孕药的年数(Hormonal.Contraceptives…years.)的SHAP依赖图,该图包含所有的点 :
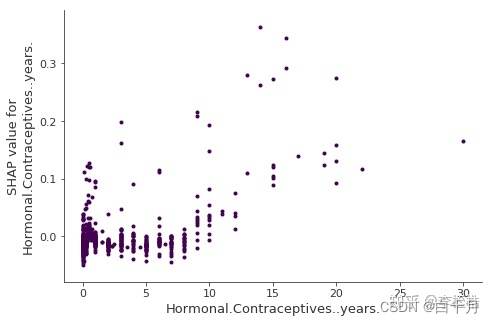
可以看到,与0年相比,服用激素避孕药的年数少则预测概率低,年数多则预测癌症概率高。
SHAP依赖图可以替代部分依赖图(Partial Dependence Plot)和累积局部效应图(Accumulated Local Effects Plot)。SHAP依赖图也显示y轴上的方差,这是因为有其他特征的相互作用,所以依赖图在y轴上会分散。通过显示这些特性交互,可以改进依赖图。
部分依赖图Partial Dependence Plot
SHAP也提供了部分依赖图的功能,与传统的部分依赖图不同的是,这里纵坐标不是目标变量y的数值而是SHAP值。
比如下图中,年纪大概呈现出金字塔分布,也就是24到31岁这个年纪对球员的身价是拉抬作用,小于24以及大于31岁的球员身价则会被年纪所累。
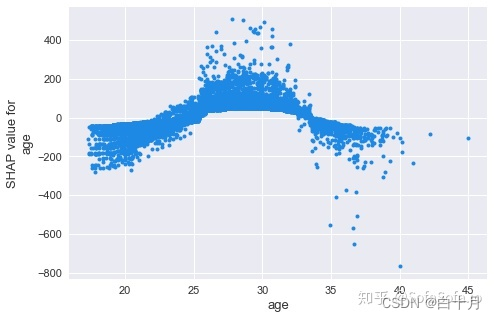
shap.dependence_plot('age', shap_values, data[cols], interaction_index=None, show=False)
对多个变量的交互进行分析
https://zhuanlan.zhihu.com/p/64799119
我们也可以多个变量的交互作用进行分析。一种方式是采用summary_plot描绘出散点图,如下:
shap_interaction_values = shap.TreeExplainer(model).shap_interaction_values(data[cols])
shap.summary_plot(shap_interaction_values, data[cols], max_display=4)
我们也可以用dependence_plot描绘两个变量交互下变量对目标值的影响。
shap.dependence_plot('potential', shap_values, data[cols], interaction_index='international_reputation', show=False)
参考链接:
https://zhuanlan.zhihu.com/p/85791430
https://zhuanlan.zhihu.com/p/338526488
https://blog.csdn.net/qq_41103204/article/details/104896630
https://zhuanlan.zhihu.com/p/64799119
Original: https://blog.csdn.net/weixin_43251493/article/details/126023831
Author: 白十月
Title: shap库源码和代码实现
原创文章受到原创版权保护。转载请注明出处:https://www.johngo689.com/719659/
转载文章受原作者版权保护。转载请注明原作者出处!