

方法一:使用pandas内置接口
在pandas中,获取数据类型有几个方法,以泰坦尼克号数据集为例,
1.拿到numerical数据类型
df.select_dtypes('number').columns
Index(['Survived', 'Pclass', 'Age', 'SibSp', 'Parch', 'Fare'], dtype='object')
- 拿到categorical数据类型
df.select_dtypes('object').columns
Index(['Name', 'Sex', 'Ticket', 'Cabin', 'Embarked'], dtype='object')
还有
df.select_dtypes('category').columns
Index([], dtype='object')
方法二:pandas_profiling输出分析
以泰坦尼克号数据集为例,如果只是康康然后疯狂复制粘贴的话那没啥,但是如果想全流程自动化,就要把ProfileReport的结果用到接下来的数据处理中,不妨把结果输出到json文件。
from pandas_profiling import ProfileReport
import pandas as pd

df = pd.read_csv('train.csv',index_col=['PassengerId'])
report = ProfileReport(df,dark_mode = True,explorative=True)

report.to_file('result.json')
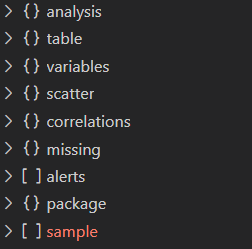
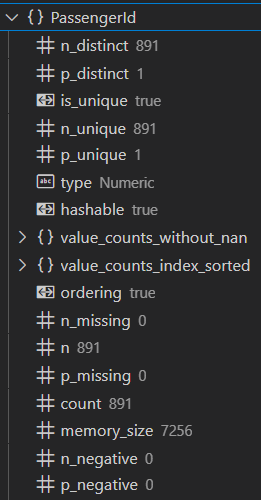
在这个json文件中,有如下的结构,取自己需要的统计即可,但是有亿点麻烦(doge)

方法三:自己动手写函数(相当于又把数据集分析了一遍doge)
def cols_spliting(df:pd.DataFrame, cardinality = 10, high_missing_per= 0.7, drop_high_missing = True):
    assert len(df.index) != 0

    binary_categorical_cols = []
    thin_categorical_cols = []
    uniform_categorical_cols = []
    categorical_cols = []
    numerical_cols = []
    other_cols = []

    high_missing_cols = []
    small_missing_cols = []
    missing_cols = []

    count = df.shape[0]

    for col in df.columns:
        unique = df[col].nunique()
        dtype = df[col].dtype

        missing_count = df[col].isnull().sum()
        per = missing_count/count

        # type determine
        if unique  2 and unique  cardinality and dtype == 'object':
            uniform_categorical_cols.append(col)
            categorical_cols.append(col)

        elif dtype in ['int64', 'float64']:
            numerical_cols.append(col)

        else:
            other_cols.append(col)

        # missing determine
        if  per > 0 and per  high_missing_per:
            high_missing_cols.append(col)
            missing_cols.append(col)

    print('--------------col types---------------')
    print('categorical cols with 1-2 distinct values: ' + str(binary_categorical_cols))
    print('categorical cols with 3-{} distinct values: '.format(cardinality) + str(thin_categorical_cols))
    print('categorical cols with more than {} distinct values: '.format(cardinality) + str(uniform_categorical_cols))
    print('categorical cols: ' + str(categorical_cols))
    print('numerical cols : ' + str(numerical_cols))
    print('-------------missing cols-------------')
    # print('categorical cols with 2-3 distinct valuses: ' + str(other_cols))
    print('missing cols with more than {} :'.format(high_missing_per) + str(high_missing_cols))
    print('missing cols with less than {} :'.format(high_missing_per) + str(small_missing_cols))
    print('missing cols: ' + str(missing_cols))
以泰坦尼克号为例:
cols_spliting(df)
结果为
missing cols with more than 0.7 : ['Cabin']
missing cols with less than 0.7 : ['Age', 'Embarked']
missing cols: ['Age', 'Cabin', 'Embarked']
如果我们对输出的数据还要要求,让他更适用于机器学习,不妨康康这个
Original: https://blog.csdn.net/RuGe_Lee/article/details/123301924
Author: 21岁害怕编程
Title: pandas获取数据集数据类型分布(更细粒度的分割)
原创文章受到原创版权保护。转载请注明出处:https://www.johngo689.com/696147/
转载文章受原作者版权保护。转载请注明原作者出处!