

文章目录
numpy
统计函数
- 求平均值mean()
m1=np.arange(20).reshape((4,5)

m1.mean()

m1.mean(axis=0)

m1.mean(axis=1)
- 中位数np.median
ar1=np.array([1,3,5,6,8])
np.median(ar1)
- 标准差ndarray.std
定义:总体各单位标准值与其平均数离差平方的算术平均数的平方根
ar1=np.array([1,3,5,6,8])
np.std(ar1)

按步骤计算标准差
import math
math.sqrt(np.sum(((ar1-np.mean(ar1))**2)/a.size))
- 方差ndarray.var()
ar1=np.array([1,3,5,6,8])
ar1.var
- 最大 ndarray.max()和最小ndarray.min()
最大:
m1.max()
m1.max(axis=0)
m1.max(axis=1)
最小:
m1.min()
求和:
m1.sum()
- 加权平均数
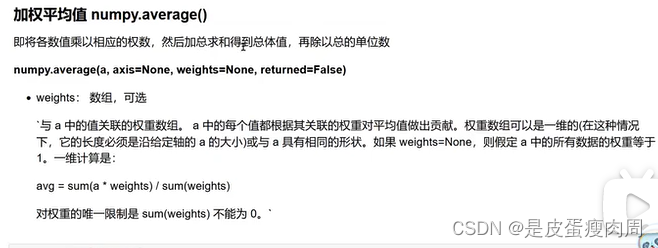


xiaoming=np.array([80,90,95])
xiaogang=np.array([95,90,80])

weights=np.array([0.2,0.3,0.5])

np.average(xiaoming,weights=weights)
np.average(xiaogang,weights=weights)
变异系数:当需要比较两组数据大小的时候,如果两组数据的测量尺度相差太大,或者数据量纲的不同,直接使用标准差来进行表示比较不合适,此时应该消除尺度和量纲的影响,而变异系数可以做到这一点,它是原始数据 标准差与原始数据平均数的比
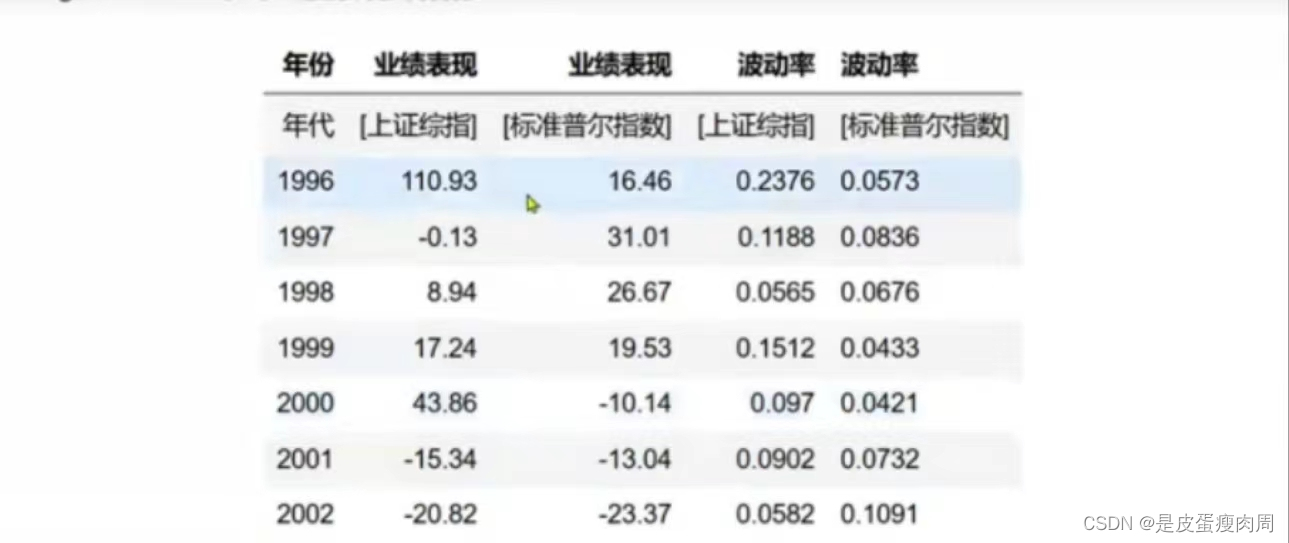
stat_info=np.array([
              [110.93,16.46,0.2376,0.0573],
              [-0.13,31.01,0.1188,0.0836],
              [8.94,26.67,0.0565,0.0676],
              [17.24,19.53,0.1512,0.0433],
              [43.86,-10.14,0.097,0.0421],
              [-15.34,-13.04,0.0902,0.0732],
              [-20.82,-23.37,0.0582,0.1091]
])

stat_mean=np.mean(stat_info,axis=0)

stat_std=np.std(stat_info,axis=0)

stat_std/stat_mean
数据类型
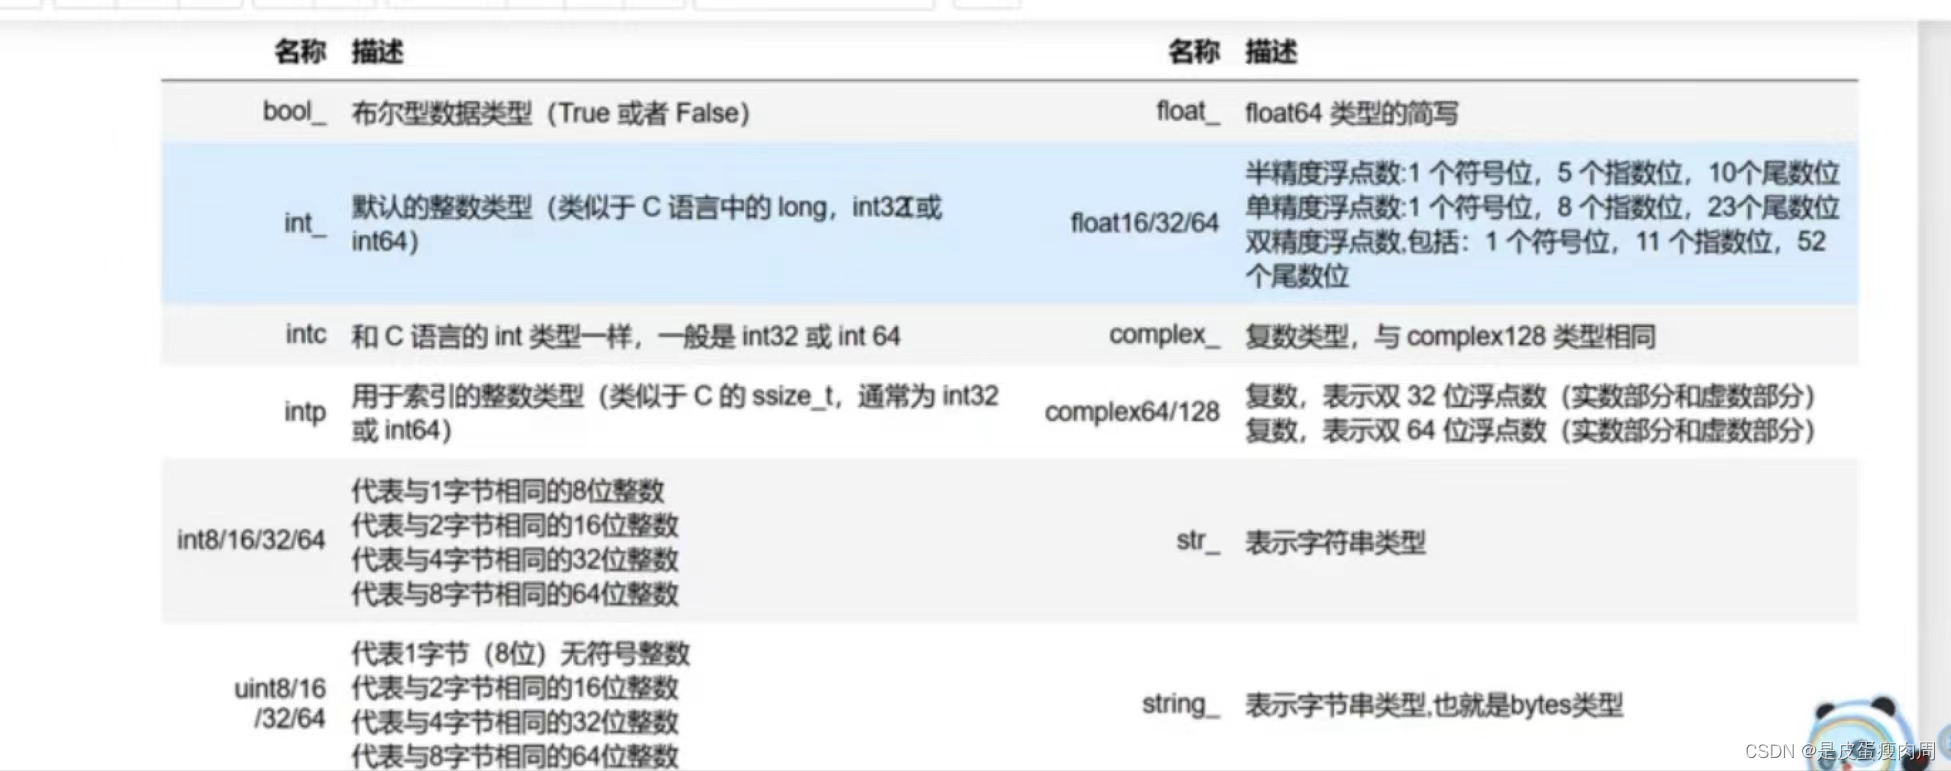
将数组类型存储为浮点型
a=np.array([1,2,3,4],dtype=np.float64)
- 定义结构化数据
随机函数
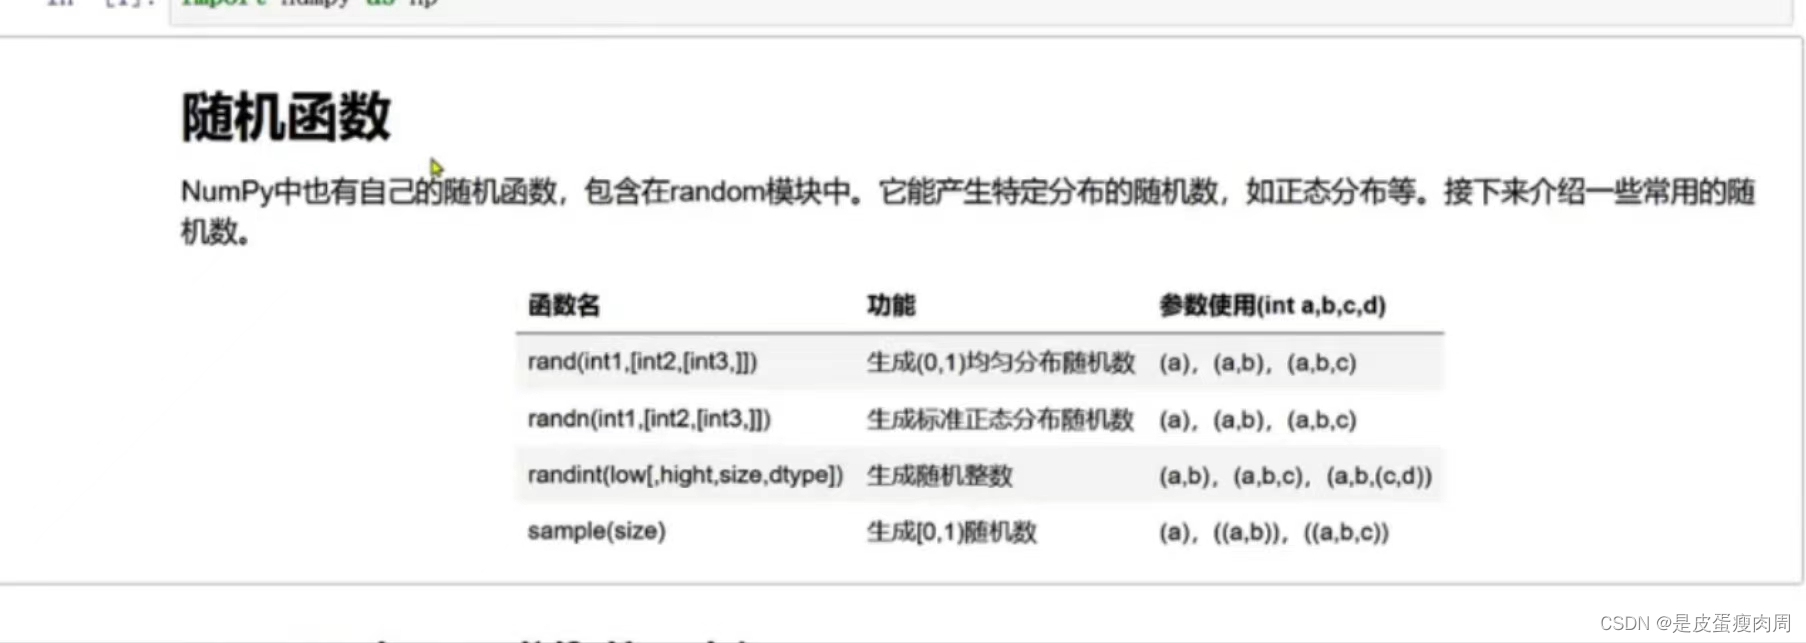
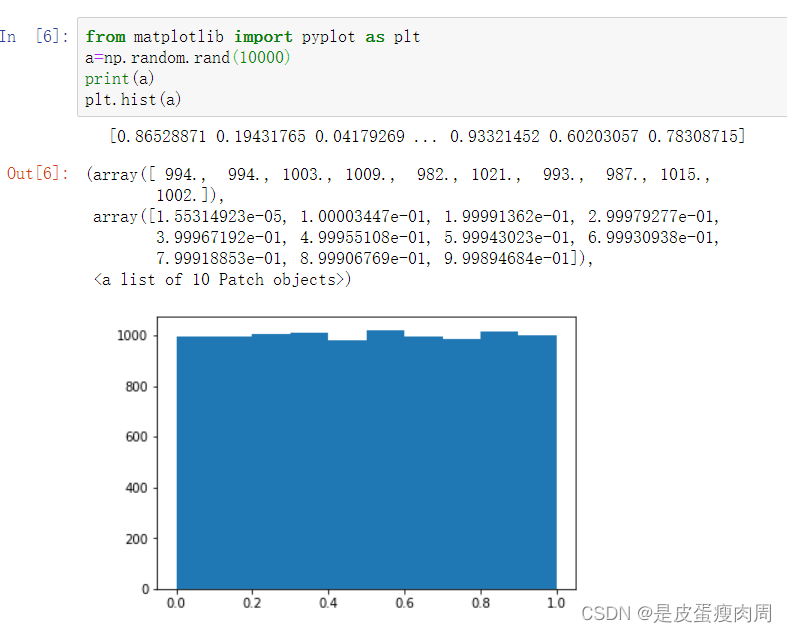
- numpy.random.rand(d0,d1,…,dn)
rand函数根据给定维度生成(0,1)之间的数据,包含0,不包含1 dn表示每个维度 返回值为指定维度的array
from matplotlib import pyplot as plt
a=np.random.rand(10000)
print(a)
plt.hist(a)
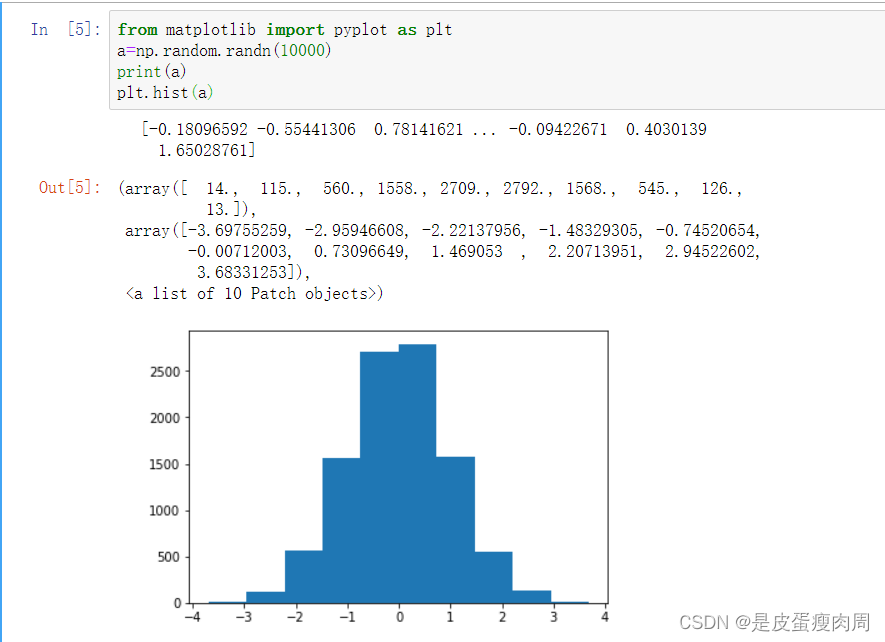
- numpy.random.randn(d0,d1,…,dn)
from matplotlib import pyplot as plt
a=np.random.randn(10000)
print(a)
plt.hist(a)
- numpy.random.randint()
numpy.random.randint(low,high=None,size=None,dtype=’1′)
返回随机整数,范围区间在[low,high),包含low,不包含high
参数:low为最小值,high为最大值,size为数组维度大小,dtype为数据类型
high没有填写时,默认生成随机数的范围是[0,low)

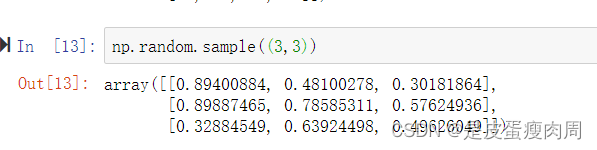
- numpy.random.sample(size=None)
返回半开区间的随机浮点数[0.0,1.0]
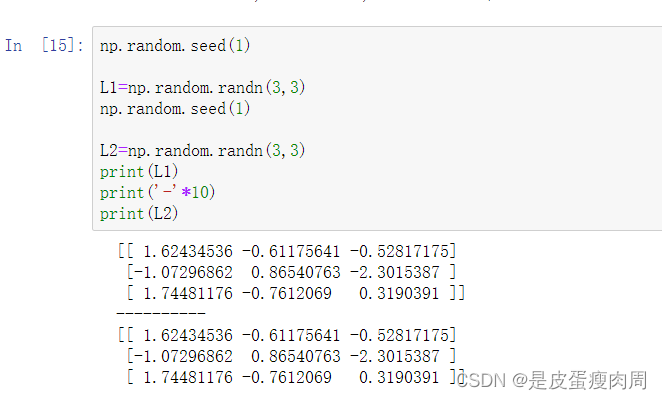
- 随机种子np.random.seed()
使用相同seed()值,则每次生成的随机数都相同,使得随机数可以预测
但是,只在调用的时候seed()一下并不能使生成的随机数相同,需要每次都调用seed()一下,表示种子相同,从而随机数相同
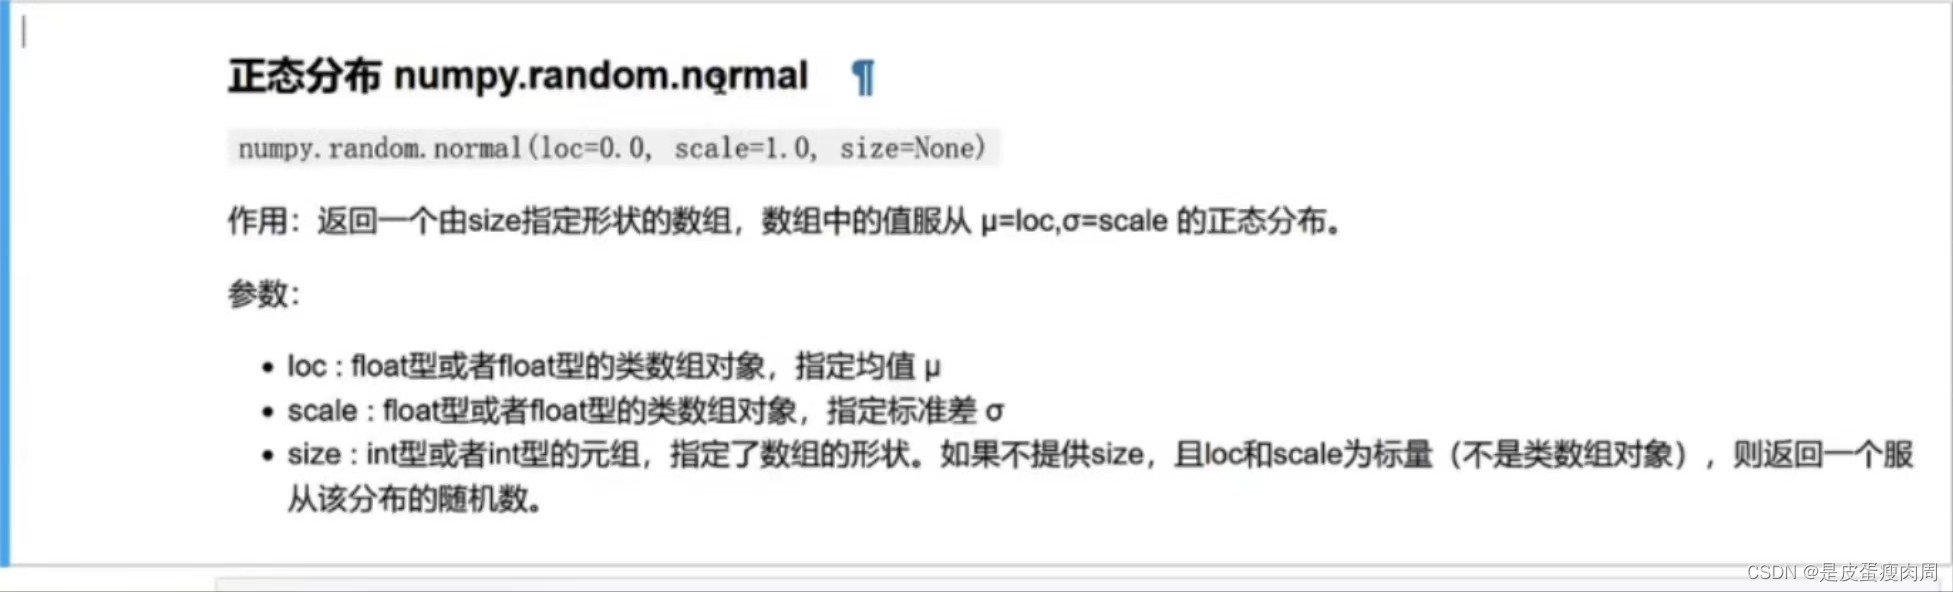
- 正态分布numpy.random.normal
数组的其他函数
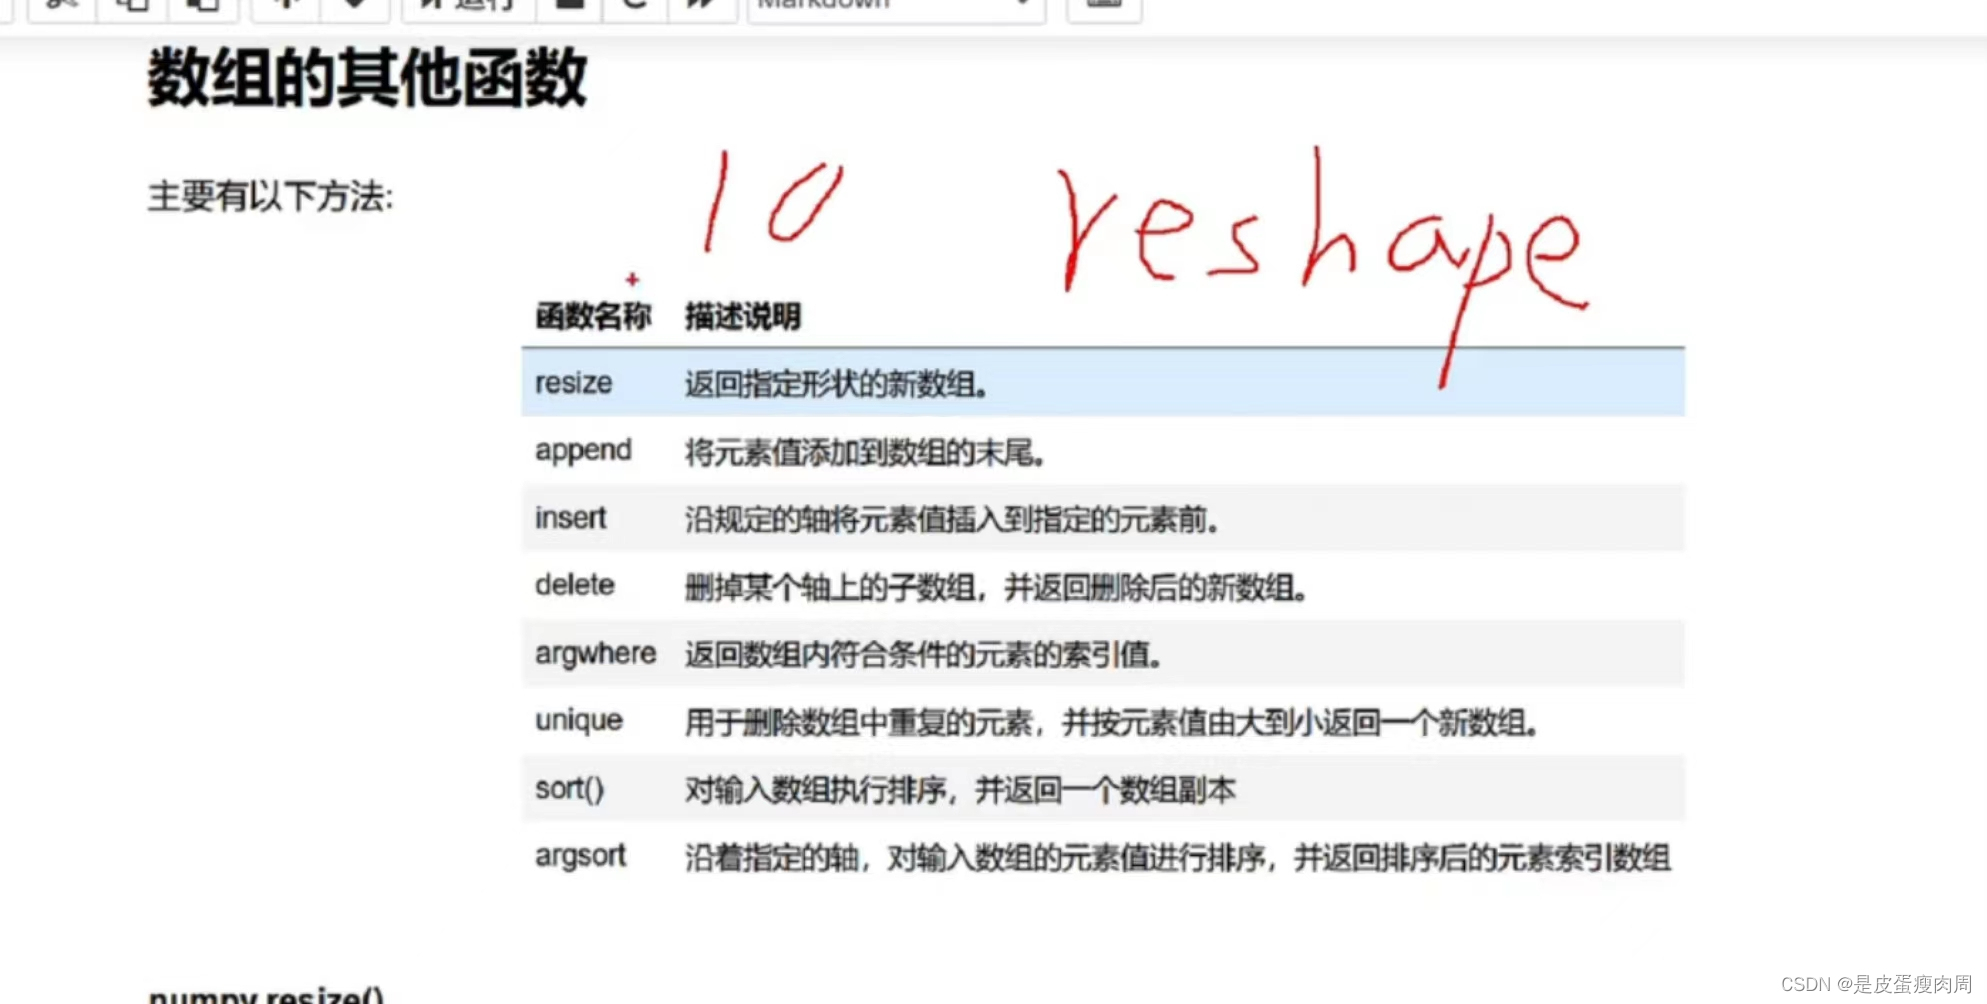
- numpy.resize()
numpy.resize()返回指定形状的新数组
numpy.resize(arr,shape)和ndarray.resize(shape,refcheck=False)区别:
numpy.resize(arr,shape),有返回值,返回复制内容。如果维度不够,会使用原数组数据补齐。
ndarray.resize(shape,refcheck=False),修改原数组,不会返回数据,如果维度不够,会使用0补齐
a=np.array([[1,2,3],[4,5,6]])
print('数组a:',a)
print('a数组形状:',a.shape)

b=np.resize(a,(3,3))
a.resize((3,3),refcheck=False)
- numpy.append(arr,values,axis=None)
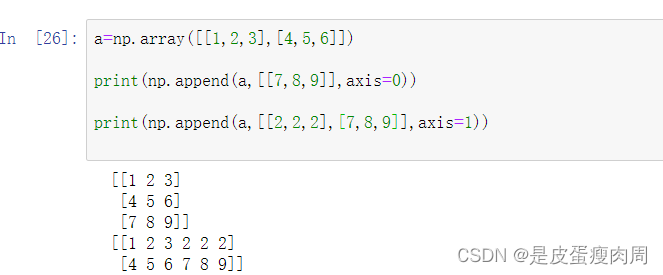
a=np.array([[1,2,3],[4,5,6]])
print(np.append(a,[[7,8,9]],axis=0))
print(np.append(a,[[2,2,2],[7,8,9]],axis=1))
- numpy.insert(arr,obj,value,axis)
arr:要输入的数组
obj:表示引值,在该索引值之前插入values值
values:要插入的值
axis:指定的轴。如果未提供,则输入数组会被展开为一维数组
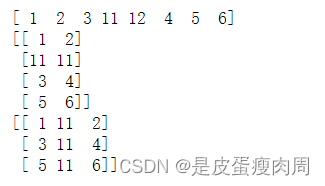
a=np.array([[1,2],[3,4],[5,6]])

print(np.insert(a,3,[11,12]))

print(np.insert(a,1,[11],axis=0)

print(np.insert(a,1,11,axis=1))
- numpy.delete(arr,obj,axis)
arr:要输入的数组
obj:整数或者整数数组,表示要被删除数组元素或者子数组
axis:沿着哪条轴删除子数组
注意:不提供axis参数,则输入数组被展开为一维数组
a=np.arange(12).reshape(3,4)

print(a)

print(np.delete(a,5))

print(np.delete(a,1,axis=1))

a=np.array([1,2,3,4,5,6,7,8,9,10])

print(np.delete(a,[1,2,3,4]))
- numpy.argwhere()
返回数组中非0元素的索引,若是多维数组则返回行,列索引组成的索引坐标
x=np.arange(6).reshape(2,3)
print(x)

y=np.argwhere(x>1)
print(y,y.shape)
Original: https://blog.csdn.net/weixin_66610130/article/details/126690755
Author: 是皮蛋瘦肉周
Title: 数据分析-numpy2
原创文章受到原创版权保护。转载请注明出处:https://www.johngo689.com/696023/
转载文章受原作者版权保护。转载请注明原作者出处!