

Pandas简介
定义
一个开源的python类库,用于数据分析、数据处理、数据可视化
特点
高性能、容易使用的数据结构、容易使用的数据分析工具
pandas数据类型
Series是由相同数据类型组成的一维数组。
DataFrame:二维的表格型数据结构,数据帧(DataFrame)是大小可变的数据结构,每列可以是不同的数据类型(整型、字符串、布尔值等)
面板(Panel)可以由不同的数据类型构成的三维数据结构,Panel是DataFrame的容器
数据结构 维数 描述 数据 大小
Series1数据可变, 一维数组,大小不可变,Series是由相同数据类型组成的一维数组。数据可变大小不可变DataFrame2二维数组,大小可变的表格结构,它含有一组有序的列,每列可以是不同的数据类型(整型、字符串、布尔值等)数据可变大小可变Panel3数据可变 大小可变的三维数组数据可变大小可变
pandas安装
pip install pandas
pip list
一维数据结构:Series对象
#查看列索引
print(d1.columns)
#查看行索引
print(d1.index)
Series对象的生成
使用Pandas.Series
"""
pandas.Series( data, index, dtype, copy)
data:数据,可以是序列类型,可以是int
index:索引值必须是唯一的,与data的长度相同,默认为np.arange(n)
dtype:数据类型
copy:是否复制数据,默认为false
打印左侧为索引,右侧为数据
"""
#如果全部是int类型,那么打印s1会显示是int类型
s1 = pd.Series([1,2,3,4]) #dtype: int64
print(s1)
#如果什么数据类型都存在,那么打印s1会显示object类型的
s1 = pd.Series([1,"a",0.5,["张三","李四"]])#dtype: object
print(s1)
s1 = pd.Series([1,"a",0.5,["张三","李四"]],index=['a','b','c','d'])
s1 = pd.Series([1,2,3,4],index=['a','b','c','d'],dtype=np.float32)
"""
copy=True后,数据x不会改变,数据s1会改变
copy=False,数据x会改变,数据s1会改变
"""
x=np.array([10,20,30,40])
s1 = pd.Series(x,index=['a','b','c','d'],copy=True)
s1['a']=100
print(s1)
print(x)
从ndarray创建一个Serie
x=np.array([10,20,30,40])
s1 = pd.Series(x)
s1 = pd.Series(x,index=['a','b','c','d'])
print(s1)
从字典创建一个Series
"""
由于我们的Series有索引有数据,和我们的字典很像,字典是有key和vaule
"""
#a是索引 100数据
x={'a':100,'b':200,'c':300,'d':400}
s1 = pd.Series(x)
#设置索引
s1 = pd.Series(x,index=['a','b','c','d'])
#如果设置的索引位置换一下呢,数据也会跟着换
s1 = pd.Series(x,index=['a','c','d','b'])
#如果设置的索引,在字典中不存在呢,为nan
s1 = pd.Series(x,index=['a','b','e','f'])
print(s1)
访问Series数据
单个索引获取数据
"""
语法:s1[index]  获取单个数据
"""
#可以使用默认索引,也可以使用自定义索引
s1 = pd.Series([1,"a",0.5,["张三","李四"]],index=['a','b','c','d'])
print(s1[0])
print(s1['a'])
多个索引获取数据
"""
语法:
s1[list] 获取索引中的数据
s1[index1:index2] 获取从第一个索引到第二个索引的数据,左开右闭
"""
s1 = pd.Series([1,"a",0.5,["张三","李四"]],index=['a','b','c','d'])
print(s1[0:4]) #左开右闭
print(s1[[0,1,2,3]])
print(s1[['a','b','c']])
print(s1['a':'b'])#获取两个数据
Series对象的使用
属性和方法 说明
axes返回Series索引列表dtype返回Series的数据类型empty判断Series是否为空,如果为空,则返回Truendim返回基础数据的位数,默认为:1size返回基础数据中的元素个数values将Series作为ndarray返回head()返回前n行tail()返回最后n行
"""
axes   返回Series索引列表
dtype   返回Series的数据类型
empty   判断Series是否为空,如果为空,则返回True
ndim    返回基础数据的维度数,默认为:1
size    返回基础数据中的元素个数
values  将Series作为ndarray返回
head()  返回前n行
tail()  返回最后n行
"""
"""
head()返回前n行(观察索引值)。默认数量为5,可以传递自定义数值。
tail()返回最后n行(观察索引值)。默认数量为5,可以传递自定义数值。
"""
s1 = pd.Series([1,"a",0.5,["张三","李四"]],index=['a','b','c','d'])
"""
print(s1.axes)
print(s1.dtype)
print(s1.empty)
print('ndim',s1.ndim)
print(s1.size)
print('type',type(s1))
print('type',type(s1.values))
"""
print('ndim',s1.ndim)
ss1 = s1.tail(3)
print(ss1)
print(type(ss1))
ss = s1.head(3)
print(ss)
print(type(ss))
1.二维数据结构:DataFrame对象
创建DataFrame对象
数据帧(DataFrame)是二维数据结构,即数据以行和列的表格方式排列。
• 功能:
– 潜在的列是不同的类型
– 大小可变
– 标记轴(行和列) – 可以对行和列执行算术运算
- Pandas中的DataFrame可以使用以下构造函数创建
– pandas.DataFrame( data, index, columns, dtype) – 参数如下:
"""
pandas.DataFrame( data, index, columns, dtype, copy)
data    支持多种数据类型,如:ndarray,series,map,lists,dict,constant和另一个DataFrame。
index   行标签,如果没有传递索引值,默认值为0,1,2,3,4.......

columns 列标签,如果没有传递索引值,默认值为0,1,2,3,4.......

dtype   每列的数据类型
copy    是否复制数据,默认值为False
"""
创建空DataFrame对象
df = pd.DataFrame()
print (df)
利用列表创建
利用单层list
x = [1,2,3,4,5,6]
df = pd.DataFrame(x,dtype=np.float32)
print(df)
利用双层list
x = [
[“tom”,10],
[“jack”,20],
[“mike”,30]
]
df = pd.DataFrame(x,columns=[‘name’,’age’])
如果是True,那么x数据不改变
df = pd.DataFrame(x,columns=[‘name’,’age’,’sex’],copy=True)
df[‘age’] = 100
print(df)
print(x)
利用数据是字典的列表创建
x = [
{‘a’:1,’b’:2},
{‘a’:10,’b’:20,’c’:30}
]
index 行索引 columns列索引
df1 = pd.DataFrame(x)
print(df1)
df1 = pd.DataFrame(x,index=[“first”,”second”])
print(df1)
如果没有c,就会默认是nun
df1 = pd.DataFrame(x,index=[“first”,”second”],columns=[‘a’,’c’])
print(df1)
利用字典创建
**#利用字典创建DataFrame
a、b是列索引,一定要设置行索引(index),否则报错
x = {‘a’:1,’b’:2}
d1 = pd.DataFrame(x,index=[‘row1’])
print(d1)
# 字典里面的v是列表类型创建DataFrame
那么默认列索引是name和age
x = {
‘name’:[‘zs’,’ls’,’ww’,’zl’],
‘age’:[14,15,16,17]
}
d1 = pd.DataFrame(x)
print(d1)
print(d1[‘age’])**
利用Series和字典的结合来创建DataFrame
"""
#只有列索引,没有行索引
s1 = pd.Series([1,2,3,4,5,6])
s2 = pd.Series([100,200,300,400,500])
"""
#列索引是one,two,行索引是index
s1 = pd.Series([1,2,3,4,5,6],index=['a','b','c','d','e','f'])
s2 = pd.Series([100,200,300,400,500],index=['a','b','c','d','e'])
x = {
    'one':s1,
    'two':s2
}
d1  = pd.DataFrame(x)
print(d1)
列的读取
"""
语法:
df[columns]  查询单列
df[[columns] ] 查询多列
查询出一列和一列都会进行降维DataFrame-----》Series
"""
x = [
    ["tom",10],
    ["jack",20],
    ["mike",30]
]
df = pd.DataFrame(x,columns=['name','age'],index=['row1','row2','row3'])
print(df)
#根据columns获取列数据
print("----------------------")
print(df['name'])
print(type(df['name'])) #
print("----------------------")
print(df[['name','age']])
print(type(df[['name','age']]))
列的添加
"""
语法:df[columns] = 数据
切记数据要是同类型的数据,
"""
x = [
    ["tom",10],
    ["jack",20],
    ["mike",30]
]
df = pd.DataFrame(x,columns=['name','age'],index=['row1','row2','row3'])
print(df)
#依据list进行创建的,添加列的时候要是list
x1 = ['nan','nv','nan']
df["three"] = x1
print("---------------------------------------------")
print(df)
"""
语法:
df1[columns]=df1[columns]+df1[columns]

"""
x = [
    {'a':1,'b':2},
    {'a':10,'b':20,'c':30}
]
df1 = pd.DataFrame(x)
print(df1)
df1['d'] = {'a':2,'b':3} 报错
#数据已经标明列了,不能使用上面的方法,我们可以使用DataFrame中的现有列添加新列
df1['d']=df1['a']+df1['b']
print("--------------------------------")
print(df1)
列的删除
“””
删除语法
del df[columns] 根据下标进行检索删除,没有返回值
df.pop(columns) 根据下标进行检索删除,并返回删除的那一列
“””
df = pd.DataFrame(d)
print (“通过传递Series添加一个新列:”)
df[‘three’]=s3
print (df)
del df[‘one’]
print (df)
df_pop = df.pop(‘two’)
print(“————————–“)
print (df_pop)
行的读取
使用loc方法
"""
语法:
loc[index] 查询一行数据
扩展
loc[index,columns]  精确到行和列,那就是一个数据
查询多行和多列(精确到第几行和第几列)
loc[[index1,index2,....],[columns1,columns12,.....]]
查询多行和多列(第几行到第几行,第几列到第几列)
不是左开右闭
loc[index1:index2,columns1:columns2]
使用布尔索引也可以查询多行多列
loc[行_布尔索引,列_布尔索引]
"""
x = [
    ["tom",10],
    ["jack",20],
    ["mike",30]
]
df = pd.DataFrame(x,columns=['name','age'],index=['row1','row2','row3'])
print(df)
print(df.loc["row1"])#查询一行数据
"""
name    tom
age      10
Name: row1, dtype: object
"""
print("---------------------------------------")
#查询一个数据 ,精确到第一行。name那一列的数据
print(df.loc["row1","name"])#tom
print("---------------------------------------")
print(df.loc[['row1','row2'],"name"]) #查询第一行和第二行的name
"""
row1     tom
row2    jack
Name: name, dtype: object
"""
print("---------------------------------------")
print(df.loc[['row1','row2'],['name','age']]) #查询第一行和第二行的name和age
"""
      name  age
row1   tom   10
row2  jack   20
"""
print("---------------------------------------")
print(df.loc['row1',['name','age']]) #第一行的name和age
"""
name    tom
age      10
Name: row1, dtype: object
"""
print("----------------------------------")
print(df.loc['row1':'row3','name'])#查询第一行到第三行的name
"""
row1     tom
row2    jack
row3    mike
Name: name, dtype: object
"""
print("----------------------------------")
print(df.loc['row1','name':'age']) #第一行的name到age
"""
name    tom
age      10
Name: row1, dtype: object
"""
print("----------------------------------")
print(df.loc['row1':'row3','name':'age'])
"""
      name  age
row1   tom   10
row2  jack   20
row3  mike   30
"""
print("----------------------------------")
b = df['age']
使用df.iloc方法
df.loc方法,根据行、列的标签值查询
df.iloc方法 根据行、列的数字位置查询
"""
语法:
iloc[num_index] 根据索引位置获取行
iloc[num_index1:num_index2] 第几行到第几行,左开右闭
iloc[[num_index1,num_index2,.....]] 第几行和第几行
iloc[num_index,num_columns] #第几行的第几列
iloc[num_index,[num_columns1,num_columns2,....]] 第几行,第几列和第几列
iloc[num_index,[num_columns1:num_columns2]] 第几行,第几列到第几列,左开右闭
"""
x = [
    ["tom",10],
    ["jack",20],
    ["mike",30]
]
df = pd.DataFrame(x,columns=['name','age'],index=['row1','row2','row3'])
print(df)
print("------------------------")
print(df.iloc[2]) #根据索引位置获取行
"""
name    mike
age       30
Name: row3, dtype: object
"""
print("------------------------")
print(df.iloc[0:2])
"""
      name  age
row1   tom   10
row2  jack   20
"""
print("------------------------")
print(df.iloc[[0,2]])
"""
      name  age
row1   tom   10
row3  mike   30
"""
print("------------------------")
print(df.iloc[2,0]) #mike

print("------------------------")
print(df.iloc[2,[0,1]])
"""
name age
row1 tom 10
row2 jack 20
"""
print("-----------------------------------------")
print(df['row1':'row3'])
"""
      name  age
row1   tom   10
row2  jack   20
row3  mike   30
row1    zs   10
row2    ls   20
row3    ww   30
"""
print("-------------ignore_index=True,则不使用索引标签----------------------------")
df1 = pd.DataFrame(y,columns=['name','age'],index=['row1','row2','row3'])
df2 = df.append(df1,ignore_index=True)
print(df2)
"""
           0      1      2     3      4      5     6
Name     Tom  James  Ricky   Vin  Steve  Minsu  Jack
Age       25     26     25    23     30     29    23
Rating  4.23   3.24   3.98  2.56    3.2    4.6   3.8
"""
print("--------df.axes返回行轴标签和列轴标签列表----------")
df_axes = df.axes
print(df_axes)
#[RangeIndex(start=0, stop=7, step=1), Index(['Name', 'Age', 'Rating'], dtype='object')]
print("--------df.dtypes返回每列的数据类型----------")
df_dtype = df.dtypes
print(df_dtype)
"""
[['Tom' 25 4.23]
 ['James' 26 3.24]
 ['Ricky' 25 3.98]
 ['Vin' 23 2.56]
 ['Steve' 30 3.2]
 ['Minsu' 29 4.6]
 ['Jack' 23 3.8]]
"""

print("-----df.head(n)返回前n行(观察索引值)。默认数量为5----")
df_head = df.head(2)
print(df_head)
"""
    Name  Age  Rating
5  Minsu   29     4.6
6   Jack   23     3.8
"""
4.Pandas常用的描述性统计信息的函数:


import pandas as pd
Create a Dictionary of series
d = {'Name': pd.Series(['Tom', 'James', 'Ricky', 'Vin', 'Steve', 'Minsu', 'Jack',
'Lee', 'David', 'Gasper', 'Betina', 'Andres']),
'Age': pd.Series([25, 26, 25, 23, 30, 29, 23, 34, 40, 30, 51, 46]),
'Rating': pd.Series([4.23, 3.24, 3.98, 2.56, 3.20, 4.6, 3.8, 3.78, 2.98,
4.80, 4.10, 3.65])}
Create a DataFrame
data = pd.DataFrame(d)
print(data)
print(data.sum())
print(data.mean())
print(data.std())
    Age    Name  Rating
0    25     Tom    4.23
1    26   James    3.24
2    25   Ricky    3.98
3    23     Vin    2.56
4    30   Steve    3.20
5    29   Minsu    4.60
6    23    Jack    3.80
7    34     Lee    3.78
8    40   David    2.98
9    30  Gasper    4.80
10   51  Betina    4.10
11   46  Andres    3.65
Age                                                     382
Name      TomJamesRickyVinSteveMinsuJackLeeDavidGasperBe...

Rating                                                44.92
dtype: object
Age       31.833333
Rating     3.743333
dtype: float64
Age       9.232682
Rating    0.661628
dtype: float64
Pandas 描述性统计函数,注意事项:
– pipe():表格函数应用,通过将函数和适当数量的参数作为管道参数来执行自定义操作,对整个DataFrame执行操作。
– apply( ) :可以沿DataFrame的轴应用任意函数,它与描述性统计方法一样,采用可选的axis参数。
– applymap() :给DataFrame的所有元素应用任何Python函数,并且返回单个值。
import pandas as pd
import numpy as np
df = pd.DataFrame(np.random.randn(5, 3), columns=['col1', 'col2', 'col3'])
print(df)
df = df.apply(np.mean)
print(df)
import pandas as pd
import numpy as np
df = pd.DataFrame(np.random.randn(5, 3), columns=['col1', 'col2', 'col3'])
print(df)
df = df.apply(np.mean)
print(df)
       col1      col2      col3
0  0.026660  0.551035  0.182109
1 -1.066038 -3.086139 -0.183103
2 -1.566943  1.022386  0.750337
3  0.813376 -0.697546  0.417025
4 -0.472393  1.457343 -0.922107
col1   -0.453067
col2   -0.150584
col3    0.048852
dtype: float64
dataframe获取行之和大于100的数据, 并返回最后的两行
01239353523291224332927
- Pandas对象之间的基本迭代的行为取决于类型。当迭代一个系列时,它 被视为数组式,基本迭代产生这些值
import pandas as pd
import numpy as np
N = 5
df = pd.DataFrame({
'X': np.linspace(0, stop=N - 1, num=N),
'Y': np.random.rand(N),
'C': np.random.choice(['Low', 'Medium', 'High'], N)
.tolist(),
})
for key, value in df.iteritems(): # 按列访问值
    print(key, value)
print("=====================")
for row_index, row in df.iterrows(): # 按行访问值
    print(row_index, row)
print("=====================")
for row in df.itertuples(): # 按行访问值
    print(row)
C 0    Medium
1    Medium
2       Low
3    Medium
4      High
Name: C, dtype: object
X 0    0.0
1    1.0
2    2.0
3    3.0
4    4.0
Name: X, dtype: float64
Y 0    0.959929
1    0.058876
2    0.756262
3    0.984280
4    0.999868
Name: Y, dtype: float64
=====================
0 C      Medium
X           0
Y    0.959929
Name: 0, dtype: object
1 C       Medium
X            1
Y    0.0588758
Name: 1, dtype: object
2 C         Low
X           2
Y    0.756262
Name: 2, dtype: object
3 C     Medium
X          3
Y    0.98428
Name: 3, dtype: object
4 C        High
X           4
Y    0.999868
Name: 4, dtype: object
=====================
Pandas(Index=0, C='Medium', X=0.0, Y=0.9599285927026967)
Pandas(Index=1, C='Medium', X=1.0, Y=0.058875797837255606)
Pandas(Index=2, C='Low', X=2.0, Y=0.75626198656391275)
Pandas(Index=3, C='Medium', X=3.0, Y=0.98427963491833415)
Pandas(Index=4, C='High', X=4.0, Y=0.99986776764752849)
Pandas中有两种排序方式:
– 按标签排序:sort_index()方法通过传递axis参数和排序顺序,可以对DataFrame进行排序。ascending=true为升序,false为降序。axis=0排序行,1为排序列。
– 按实际值:sort_values()是按值排序的方法。它接受一个by参数,指定排序列名
import pandas as pd
import numpy as np
unsorted_df = pd.DataFrame(np.random.randn(10, 2),
                           index=[1, 4, 6, 2, 3, 5, 9, 8, 0, 7],
                           columns=['col2', 'col1'])
print(unsorted_df)
sorted_df = unsorted_df.sort_index()
print(sorted_df) # 按索引排序
sorted_df = unsorted_df.sort_values(by='col1')
print(sorted_df) # 按col1排序
col2 col1
1 1.440434 1.725768
4 0.009801 0.196239
6 0.923630 0.890150
2 0.185936 0.202835
3 0.690447 -0.141488
5 1.662561 1.752920
9 -0.157736 0.405503
8 -1.419687 -0.044129
0 -0.053966 -0.605254
7 -1.571451 -0.328177
col2 col1
0 -0.053966 -0.605254
1 1.440434 1.725768
2 0.185936 0.202835
3 0.690447 -0.141488
4 0.009801 0.196239
5 1.662561 1.752920
6 0.923630 0.890150
7 -1.571451 -0.328177
8 -1.419687 -0.044129
9 -0.157736 0.405503
col2 col1
0 -0.053966 -0.605254
7 -1.571451 -0.328177
3 0.690447 -0.141488
8 -1.419687 -0.044129
4 0.009801 0.196239
2 0.185936 0.202835
9 -0.157736 0.405503
6 0.923630 0.890150
1 1.440434 1.725768
5 1.662561 1.752920
5. Pandas函数应用
常用字符串文本函数列表如下:
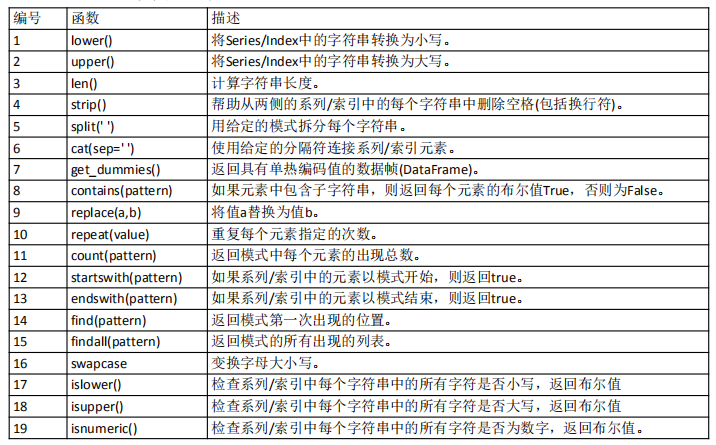
import pandas as pd
import numpy as np
s = pd.Series(['Tom', 'William Rick', 'John',
'Alber@t', np.nan, '1234', 'SteveMinsu'])
print(s.str.lower())
print(s.str.upper())
print(s.str.len())
print(s.str.find('e'))
print(s.str.count('m'))
0             tom
1    william rick
2            john
3         alber@t
4             NaN
5            1234
6      steveminsu
dtype: object
0             TOM
1    WILLIAM RICK
2            JOHN
3         ALBER@T
4             NaN
5            1234
6      STEVEMINSU
dtype: object
0     3.0
1    12.0
2     4.0
3     7.0
4     NaN
5     4.0
6    10.0
dtype: float64
0   -1.0
1   -1.0
2   -1.0
3    3.0
4    NaN
5   -1.0
6    2.0
dtype: float64
0    1.0
1    1.0
2    0.0
3    0.0
4    NaN
5    0.0
6    0.0
dtype: float64
python pipe模块用法
DataFrame.pipe(self, func, *args, kwargs)**
适用 func(self, *args, **kwargs)
参数:
func : function
函数可应用于 Series/DataFrame。
args和 kwargs被传递到func。
或者是一个 (callable,data_keyword)元组,
其中 data_keyword是一个字符串,
表示可调用的关键字,
该关键字需要 Series/DataFrame。
args:iterable(可迭代),可选
位置参数传递给 func。
kwargs: mapping, 可选
关键字参数字典传入 func。
返回值:
object :返回类型 func。
Notes
.pipe在将需要Series,DataFrames或GroupBy对象的函数链接在一起时使用。而不是写:
>>> f(g(h(df), arg1=a), arg2=b, arg3=c)
你可以写,
>>> (df.pipe(h)
...    .pipe(g, arg1=a)
...    .pipe(f, arg2=b, arg3=c)
... )
如果您有一个将数据作为(例如)第二个参数的函数,则传递一个元组,指示哪个关键字需要该数据。例如,假设f将其数据作为arg2:
>>> (df.pipe(h)
...    .pipe(g, arg1=a)
...    .pipe((f, 'arg2'), arg1=a, arg3=c)
...  )
一 Python apply函数
1、介绍
apply函数是pandas里面所有函数中自由度最高的函数。该函数如下:
DataFrame.apply(func, axis=0, broadcast=False, raw=False, reduce=None, args=(), **kwds)
该函数最有用的是第一个参数,这个参数是函数,相当于C/C++的函数指针。
对数据框(DataFrame)的 每一个数据进行操作时用applymap()
这个函数需要自己实现,函数的传入参数根据axis来定,比如axis = 1,就会把一行数据作为Series的数据 结构传入给自己实现的函数中,我们在函数中实现对Series不同属性之间的计算,返回一个结果,则apply函数 会自动遍历每一行DataFrame的数据,最后将所有结果组合成一个Series数据结构并返回。 2、样例
import numpy as np
import pandas as pd

f = lambda x: x.max()-x.min()

df = pd.DataFrame(np.random.randn(4,3),columns=list('bde'),index=['utah', 'ohio', 'texas', 'oregon'])
print(df)

t1 = df.apply(f)
print(t1)

t2 = df.apply(f, axis=1)
print(t2)
输出结果如下所示:
               b         d         e
utah    1.106486  0.101113 -0.494279
ohio    0.955676 -1.889499  0.522151
texas   1.891144 -0.670588  0.106530
oregon -0.062372  0.991231  0.294464

b    1.953516
d    2.880730
e    1.016430
dtype: float64

utah      1.600766
ohio      2.845175
texas     2.561732
oregon    1.053603
dtype: float64
3、性能比较
df = pd.DataFrame({'a': np.random.randn(6),
                   'b': ['foo', 'bar'] * 3,
                   'c': np.random.randn(6)})

def my_test(a, b):
    return a + b

print(df)

df['Value'] = df.apply(lambda row: my_test(row['a'], row['c']), axis=1) # 方法1
print(df)

df['Value2'] = df['a'] + df['c']  # 方法2
print(df)
输出结果如下:
          a    b         c
0 -1.194841  foo  1.648214
1 -0.377554  bar  0.496678
2  1.524940  foo -1.245333
3 -0.248150  bar  1.526515
4  0.283395  foo  1.282233
5  0.117674  bar -0.094462

          a    b         c     Value
0 -1.194841  foo  1.648214  0.453374
1 -0.377554  bar  0.496678  0.119124
2  1.524940  foo -1.245333  0.279607
3 -0.248150  bar  1.526515  1.278365
4  0.283395  foo  1.282233  1.565628
5  0.117674  bar -0.094462  0.023212

          a    b         c     Value    Value2
0 -1.194841  foo  1.648214  0.453374  0.453374
1 -0.377554  bar  0.496678  0.119124  0.119124
2  1.524940  foo -1.245333  0.279607  0.279607
3 -0.248150  bar  1.526515  1.278365  1.278365
4  0.283395  foo  1.282233  1.565628  1.565628
5  0.117674  bar -0.094462  0.023212  0.023212
注意:当数据量很大时,对于简单的逻辑处理建议方法2!
二 .applymap
对数据框(DataFrame)的 每一个数据进行操作时用applymap()
s7=o.Series([9,6,3,7,4,18,2,3],index=["r1","r2","r3","r4","r5r","r6","r7","r8"])
s6=o.Series([" ss,删从 ","    晴天","默","天"," 删 是","晴人","默啊","天是"],index=["r1","r2","r3","r4","r5r","r6","r7","r8"])

otr={   "七里香":s7,
        "可及":s6
}
df3=o.DataFrame(otr)
#def ii(i):
    #if isinstance(i,int):
         #return i+1
    #else:
           #return i
#q=df3.applymap(ii)
#print(q)
    七里香       可及
r1    10   ss,删从
r2     7       晴天
r3     4        默
r4     8        天
r5r    5      删 是
r6    19       晴人
r7     3       默啊
r8     4       天是
applymap使用总结:将行数作用在表格中每个单元的数据上,但是只能用在DataFrame类型上
修改标签列索引和行索引
语法:
- df.index=值
- *df.columns=值
#df.index=['row1','row2','row3','row4','row5','row6','row7']
#p#rint("------------------------------")
#print (df)
"""
          0   1     2
row1    Tom  25  4.23
row2  James  26  3.24
row3  Ricky  25  3.98
row4    Vin  23  2.56
row5  Steve  30  3.20
row6  Minsu  29  4.60
row7   Jack  23  3.80
"""
DataFrame.reindex_like(self: ~FrameOrSeries, other, method: Union[ str , NoneType] = None, copy: bool = True, limit=None, tolerance=None) → ~FrameOrSeries
返回具有匹配索引的对象作为其他对象。
使对象在所有轴上都具有相同的索引。可选的填充逻辑,将 NaN放在上一个索引中没有值的位置。除非新索引等于当前索引并且 copy=False,否则将生成一个新对象。
参数:
other:相同数据类型的 Object
它的行和列索引用于定义此对象的新索引。
method:
{None, ‘backfill’/’bfill’, ‘pad’/’ffill’, ‘nearest’}
方法,用于填充重新索引的数据格式中的漏洞。
请注意:这只适用于索引为单调递增/递减的 DataFrames/Series。
1)None (default): 不填补空白。
2)pad / ffill: 将上一个有效观察值传播到下一个有效观察值。
3)backfill / bfill: 使用下一个有效观察值来填补空白。
4)nearest: 使用最近的有效观测值来填补空白。
copy: bool,默认为 True
即使传递的索引相同,也返回一个新对象。
limit: int, 默认为 None
填写不完全匹配的连续标签的最大数量。
tolerance:可选
最大距离之间的原始和新标签不准确的匹配。
匹配位置的索引值最满足等式
abs(index[indexer] - target) <= tolerance< code>。<!--= tolerance<-->
tolerance可以是标量值,它对所有值应用相同的tolerance,
也可以是类似于列表的值,它对每个元素应用可变tolerance。
类列表包括列表、元组、数组、序列,并且必须与索引大小相同,
其dtype必须与索引的类型完全匹配。
0.21.0版本中新增内容:(list-like tolerance)
返回值:
Series 或 DataFrame:
与调用者相同的类型,但每个轴上的索引均已更改。
调用 .reindex(index=other.index, columns=other.columns,...)相同。
例子
>>> df1 = pd.DataFrame([[24.3, 75.7, 'high'],
...                     [31, 87.8, 'high'],
...                     [22, 71.6, 'medium'],
...                     [35, 95, 'medium']],
...                    columns=['temp_celsius', 'temp_fahrenheit',
...                             'windspeed'],
...                    index=pd.date_range(start='2014-02-12',
...                                        end='2014-02-15', freq='D'))
>>> df1
            temp_celsius  temp_fahrenheit windspeed
2014-02-12          24.3             75.7      high
2014-02-13          31.0             87.8      high
2014-02-14          22.0             71.6    medium
2014-02-15          35.0             95.0    medium
>>> df2 = pd.DataFrame([[28, 'low'],
...                     [30, 'low'],
...                     [35.1, 'medium']],
...                    columns=['temp_celsius', 'windspeed'],
...                    index=pd.DatetimeIndex(['2014-02-12', '2014-02-13',
...                                            '2014-02-15']))
>>> df2
            temp_celsius windspeed
2014-02-12          28.0       low
2014-02-13          30.0       low
2014-02-15          35.1    medium
>>> df2.reindex_like(df1)
            temp_celsius  temp_fahrenheit windspeed
2014-02-12          28.0              NaN       low
2014-02-13          30.0              NaN       low
2014-02-14           NaN              NaN       NaN
2014-02-15          35.1              NaN    medium
Original: https://blog.csdn.net/weixin_52550626/article/details/121839662
Author: 送秋三十五
Title: pandas模块
原创文章受到原创版权保护。转载请注明出处:https://www.johngo689.com/678025/
转载文章受原作者版权保护。转载请注明原作者出处!