

1.data structure:
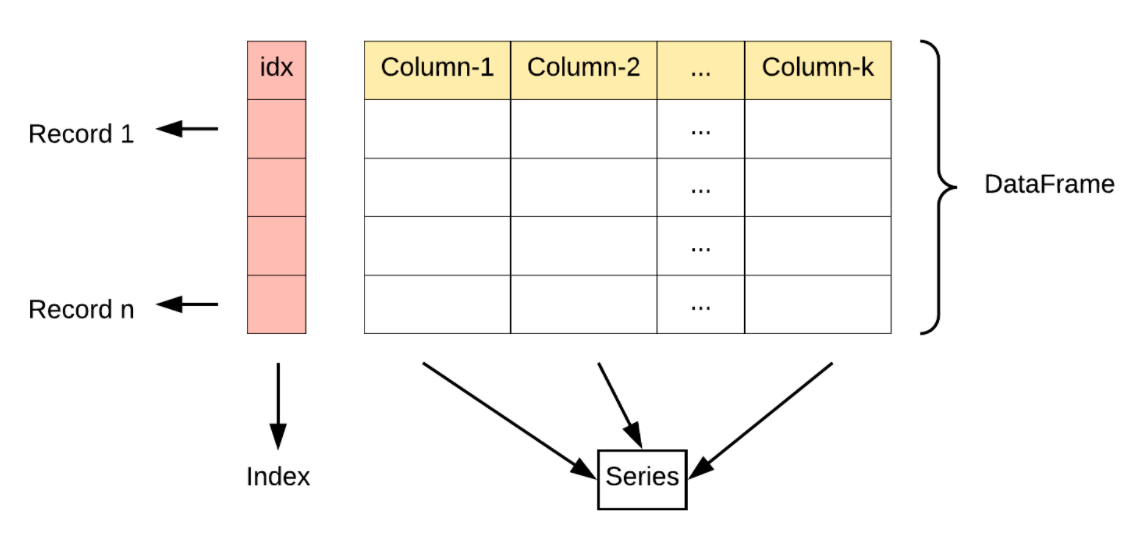
Series:
Series is a one-dimensional labeledarray capable of holding any data type (integers, strings, floating point numbers,Python objects, etc.).
s = pd.Series(data, index=index, dtype, name, copy))
data:
- a Python dict
- an ndarray
- a scalar value (like 5)
index:
索引,默认为0 ~ (length-1),也可自行以list形式设置
eg1 data为randn生成
s = pd.Series(np.random.randn(5), index=["a", "b", "c", "d", "e"])
s
a 0.469112
b -0.282863
c -1.509059
d -1.135632
e 1.212112
dtype: float64
eg2 data 为dict
d = {"b": 1, "a": 0, "c": 2}
pd.Series(d)
Out:
b 1
a 0
c 2

data为dict类型时,若index不默认设置,则key变为索引值
DataFrame
DataFrame 是一个表格型的数据结构

pandas.DataFrame( data, index, columns, dtype, copy)
- data:一组数据(ndarray、series, map, lists, dict 等类型)。
- index:索引值,或者可以称为 行标签。
- columns: 列标签,默认为 RangeIndex (0, 1, 2, …, n) 。
- dtype:数据类型。
- copy:拷贝数据,默认为 False。
eg1: data 为 dict
Pre-defined lists
names = ['United States', 'Australia', 'Japan', 'India', 'Russia', 'Morocco', 'Egypt']
dr = [True, False, False, False, True, True, True]
cpc = [809, 731, 588, 18, 200, 70, 45]
Import pandas as pd
import pandas as pd
Create dictionary my_dict with three key:value pairs: my_dict
my_dict = {'country' : names, 'drives_right' : dr,'car_per_cap' : cpc}
Build a DataFrame cars from my_dict: cars
cars=pd.DataFrame(my_dict)
Definition of row_labels
row_labels = ['US', 'AUS', 'JPN', 'IN', 'RU', 'MOR', 'EG']
Specify row labels of cars 设置行label,列label默认为key
cars.index=row_labels
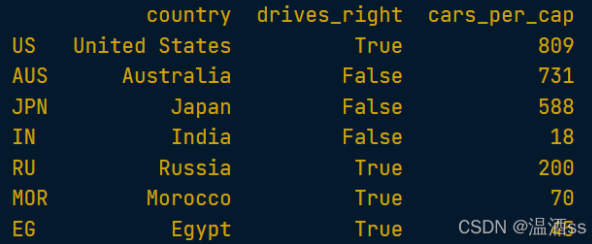
print(cars)
Pandas CSV
1. 读入csv数据
Import the cars.csv
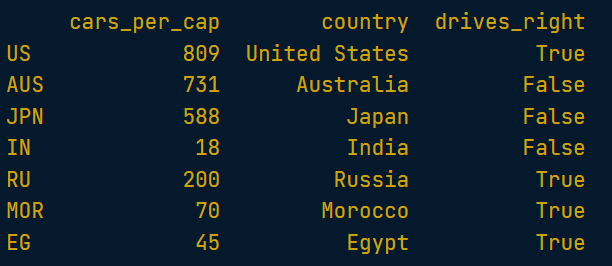
cars = pd.read_csv('cars.csv',index_col=0)
#index_col=0 即用csv中第1列作为 row label,index_col=1, 即用csv中第2列为 row label,由此类推... ; 默认情况下: index_col 为0,1,2,3...
print(cars.to_string())
to_string()用于返回 DataFrame 类型的数据,如果不使用该函数,则输出结果为数据的前面 5 行和末尾 5 行,中间部分以 … 代替。
outcome
2. 将 DataFrame 存储为 csv 文件:
cars.to_csv('cars.csv')
3.数据处理
读取前n行
head( n ) 方法用于读取前面的 n 行,如果不填参数 n ,默认返回 5 行。
print(cars.head(n))
读取后n行
print(cars.tail(n))
获取某列
++++++++以label+++++++++为索引

#print as series
print(cars['country'])

#print as dataframe:
 print(cars[['country']])

Print out DataFrame with country and drives_right columns
print(cars[['country','drives_right']])

+++++++以序号为索引+++++++++

Print out first 3 observations
print(cars[0:3])

Print out fourth, fifth and sixth observation
print(cars[3:6])
打印某行/某列(通用)
#打印某行

print as series:

cars.loc['RU']
cars.iloc[4]

print as dataFrame:

cars.loc[['RU']]
cars.iloc[[4]]

cars.loc[['RU', 'AUS']]
cars.iloc[[4, 1]]
打印某个位置的元素
print as series:

cars.loc['IN', 'cars_per_cap']
cars.iloc[3, 0]

cars.loc[['IN', 'RU'], ['cars_per_cap', 'country']] # [[行m,行n],[列i,列j]]
cars.iloc[[3, 4], [0, 1]]

print as dataFrame:
cars.loc[[['IN', 'RU']], [['cars_per_cap', 'country']]]
4.数据清洗
删除空白数据
DataFrame.dropna(axis=0, how='any', thresh=None, subset=None, inplace=False)
- axis:默认为 0,表示逢空值剔除整行,如果设置参数 axis=1 表示逢空值去掉整列。
- how:默认为 ‘any’ 如果一行(或一列)里任何一个数据有出现 NA 就去掉整行,如果设置 how=’all’ 一行(或列)都是 NA 才去掉这整行。
- thresh:设置需要多少非空值的数据才可以保留下来的。
- subset:设置想要检查的列。如果是多个列,可以使用列名的 list 作为参数。
- inplace:如果设置 True,将计算得到的值直接覆盖之前的值并返回 None,修改的是源数据。
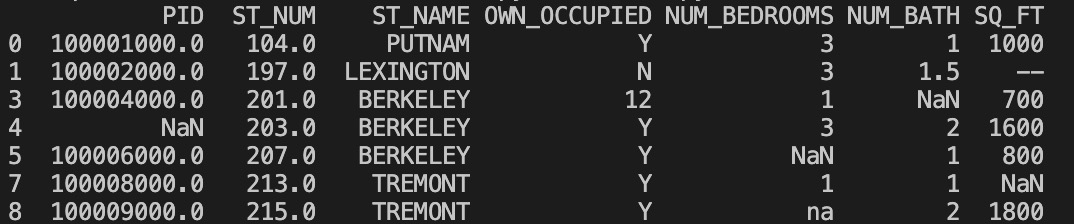
(1)Pandas默认的空白数字
Pandas 把 n/a 和 NA 当作空数据,na 不是空数据
(2)设置空白数字
import pandas as pd

missing_values = ["n/a", "na", "--"]

df = pd.read_csv('property-data.csv', na_values = missing_values)
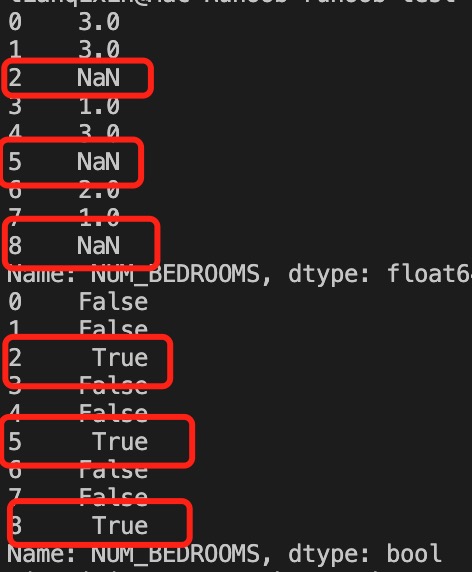
(3)判断某列各个单元格是否为空
print (df['NUM_BEDROOMS'].isnull())
返回:
(4)删除
删除指定列中包含空值的行
df.dropna(subset=['ST_NUM'], inplace = True)
(5)replace
对整个dataFrame进行操作
df.fillna(12345, inplace = True)
对指定列进行操作
df['PID'].fillna(12345, inplace = True)
删除重复数据
用 dupicated()判断,如果对应的数据是重复的, duplicated() 会返回 True,否则返回 False。
print(df.duplicated())
结果:

0    False
1    False
2     True
3    False
dtype: bool
用 drop_duplicates() 删除
df.drop_duplicates(inplace=True)
删除符合某些条件的数据
import pandas as pd

person = {
  "name": ['Google', 'Runoob' , 'Taobao'],
  "age": [50, 40, 12345]    # 12345 年龄数据是错误的
}

df = pd.DataFrame(person)

for x in df.index:
  if df.loc[x, "age"] > 120:
    df.drop(x, inplace = True)

print(df.to_string())
5.计算
中位数/均值/众数
median()、mean() 和 mode()
x = df["ST_NUM"].mean()
6.其他功能函数
(1) dataFrame.shift()
DataFrame.shift(periods=1, freq=None, axis=0)
[该部分参考自pandas常用函数之shift – pinweihelai – 博客园 ,仅用于个人学习]
假如现在有一个DataFrame数据df,如下所示:
indexvalue1A0B1C2D3
df.shift()
#等价于df.shift(1)
#df.shift(2)  即表示向下移2
#df.shift(-1) 即表示向上移1
就会变成:
indexvalue1ANaNB0C1D2
(2) dataFrame.pct_change(n)
表示当前元素与先前元素的相差百分比,当然指定periods=n,表示当前元素与先前n 个元素的相差百分比。
(3)heatmap 热度图
Plot rectangular data as a color-encoded matrix.
import seaborn as sns
sns.heatmap(dataset )
heatmap(data, vmin=None, vmax=None, cmap=None, center=None, robust=False, annot=None, fmt=’.2g’, annot_kws=None, linewidths=0, linecolor=’white’, cbar=True, cbar_kws=None, cbar_ax=None, square=False, xticklabels=’auto’, yticklabels=’auto’, mask=None, ax=None, **kwargs)
key index:
annot : If True, write the data value in each cell.
Original: https://blog.csdn.net/qq_43123477/article/details/122769637
Author: 温酒ss
Title: Pandas 函数
原创文章受到原创版权保护。转载请注明出处:https://www.johngo689.com/675345/
转载文章受原作者版权保护。转载请注明原作者出处!