

Case: German Credit
在这份作业中,我们使用了Logstic Regression模型对German Credit数据集进行了分类。并用混淆矩阵和ROC曲线对模型进行了评估。
若对本文存有疑问或获取数据代码,请直接私信博主或直接添加博主VX: 1178623893
The German Credit data set contains observations on 30 variables for 1000 past applicants for credit. Each applicant was rated as “good credit”(700 cases) or “bad credit” (300 cases).
Assignment
1. Review the predictor variables and guess from their definition at what their role might be in a credit decision. Are there any surprises in the data?
2.Divide the data randomly into training (60%) and validation (40%) partitions, and develop classification models using the following data mining techniques in XLMiner
3.Choose one model from each technique and report the confusion matrix and the cost/gain matrix for the validation data. For the logistic regression model use a cutoff “predicted probability of success” (“success”=1) of 0.5. Which technique gives the most net profit on the validation data?
4. Let’s see if we can improve our performance by changing the cutoff. Rather than accepting above classification of everones’s credit status, let’s use the “predicted probability of finding a good applicant” in logistic regression as a basis for selecting the best credit risks first, followed by poorer risk applicants.
a. Sort the test data on "predicted probability of success."

b. For each test case, calculate the actual cost/gain of extending credit.

c. Add another column for cumulative net profit.

d. How far into the test data do you go to get maximum net profit? (Often this is specified as a percentile or rounded to deciles.)

e. If this logistic regression model is scored to future applicants, what "probability of success" cutoff should be used in extending credit?
import pandas as pd
import numpy as np
import seaborn as sns
import matplotlib.pyplot as plt
import pandas_profiling
from sklearn.preprocessing import StandardScaler
from sklearn.linear_model import LogisticRegression
from sklearn import metrics
from sklearn.model_selection import train_test_split
import warnings
warnings.filterwarnings("ignore")
Q1. Review the predictor variables and guess from their definition at what their role might be in a credit decision. Are there any surprises in the data?
df = pd.read_excel(r'GermanCredit.xlsx')
df.head(10)
OBS#CHK_ACCTDURATIONHISTORYNEW_CARUSED_CARFURNITURERADIO/TVEDUCATIONRETRAINING…AGEOTHER_INSTALLRENTOWN_RESNUM_CREDITSJOBNUM_DEPENDENTSTELEPHONEFOREIGNRESPONSE01064000100…67001221101121482000100…22001121000233124000010…49001112001340422001000…45000122001450243100000…53000222000563362000010…35000112101673242001000…53001121001781362010000…35010131101893122000100…610011110019101304100000…28001231000
10 rows × 32 columns
df.info()
<class 'pandas.core.frame.dataframe'>
RangeIndex: 1000 entries, 0 to 999
Data columns (total 32 columns):
# Column Non-Null Count Dtype
The modelling results:
The slope of the logistic regression technique: [[-0.03410161 0.62564931 -0.48414517 0.504973 -0.45165218 0.11433931
-0.18546591 0.09348364 -0.23355452 -0.07481663 -0.17873389 0.52594587
0.245582 -0.3468231 0.02593704 0.37926205 0.15389971 -0.06706053
0.16737355 -0.03974959 0.14224639 -0.25124865 0.04792307 -0.26928597
-0.51482951 -0.24693031 -0.19668434 0.02740041 -0.02860024 0.20056279
0.27471923]]
The intercept of the logistic regression technique: [1.38831511]
Number of successes from verification results: 315.0
Number of successes from model calculation results: 315
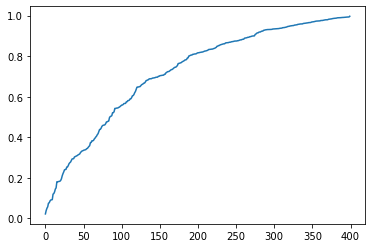
X_test.loc[:,'Score'] = s

X_test.sort_values("Score",inplace=True)
plt.plot(X_test.loc[:,'Score'].values)
plt.show()
X_test

OBS#CHK_ACCTDURATIONHISTORYNEW_CARUSED_CARFURNITURERADIO/TVEDUCATIONRETRAINING…AGEOTHER_INSTALLRENTOWN_RESNUM_CREDITSJOBNUM_DEPENDENTSTELEPHONEFOREIGNScore9729730241100000…29010201000.0215433343350240001000…23110222000.0382627287291481000001…59010121000.04949359600364001000…23010211100.05644711120482000001…24010121000.074500…………………………………………………………519520364000100…36000221000.9928151351363124000100…38001221100.9928975675683244000100…34001121000.992978156157094000000…48001222010.9932142092103122010000…55001121010.996783
400 rows × 32 columns
print('The sorted test data on "predicted probability of success" as follows:')
X_test.loc[:,'Score']
The sorted test data on "predicted probability of success" as follows:

972    0.021543
334    0.038262
728    0.049493
59     0.056447
11     0.074500
         ...

519    0.992815
135    0.992897
567    0.992978
156    0.993214
209    0.996783
Name: Score, Length: 400, dtype: float64
Q4.b
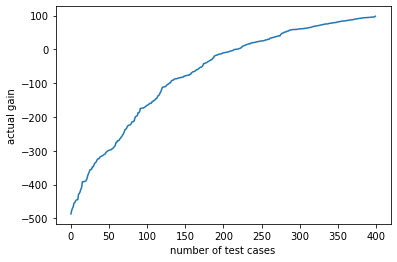
For each test case, calculate the actual cost/gain of extending credit.
actual_gain = X_test['Score']*100-500*(1-X_test['Score'])
X_test.loc[:,'Actual_gain'] = actual_gain
plt.plot(actual_gain.values)
plt.xlabel('number of test cases')
plt.ylabel('actual gain')
plt.show()
X_test
OBS#CHK_ACCTDURATIONHISTORYNEW_CARUSED_CARFURNITURERADIO/TVEDUCATIONRETRAINING…OTHER_INSTALLRENTOWN_RESNUM_CREDITSJOBNUM_DEPENDENTSTELEPHONEFOREIGNScoreActual_gain9729730241100000…010201000.021543-487.0744353343350240001000…110222000.038262-477.0429257287291481000001…010121000.049493-470.30418259600364001000…010211100.056447-466.13208011120482000001…010121000.074500-455.300084…………………………………………………………519520364000100…000221000.99281595.6888381351363124000100…001221100.99289795.7380595675683244000100…001121000.99297895.786722156157094000000…001222010.99321495.9283152092103122010000…001121010.99678398.069581
400 rows × 33 columns
print('The actual cost/gain of extending credit for each case as follows:')
X_test.loc[:,'Actual_gain']
The actual cost/gain of extending credit for each case as follows:

972   -487.074435
334   -477.042925
728   -470.304182
59    -466.132080
11    -455.300084
          ...

519     95.688838
135     95.738059
567     95.786722
156     95.928315
209     98.069581
Name: Actual_gain, Length: 400, dtype: float64
Q4.c
Add another column for cumulative net profit.
cumulate_net_profit = np.cumsum(actual_gain)
X_test.loc[:,'Cumulate_net_profit'] = cumulate_net_profit
plt.plot(cumulate_net_profit.values)
plt.xlabel('number of test cases')
plt.ylabel('cumulate net profit')
plt.show()
X_test

OBS#CHK_ACCTDURATIONHISTORYNEW_CARUSED_CARFURNITURERADIO/TVEDUCATIONRETRAINING…RENTOWN_RESNUM_CREDITSJOBNUM_DEPENDENTSTELEPHONEFOREIGNScoreActual_gainCumulate_net_profit9729730241100000…10201000.021543-487.074435-487.0744353343350240001000…10222000.038262-477.042925-964.1173607287291481000001…10121000.049493-470.304182-1434.42154259600364001000…10211100.056447-466.132080-1900.55362211120482000001…10121000.074500-455.300084-2355.853706…………………………………………………………519520364000100…00221000.99281595.688838-28084.1739741351363124000100…01221100.99289795.738059-27988.4359155675683244000100…01121000.99297895.786722-27892.649194156157094000000…01222010.99321495.928315-27796.7208782092103122010000…01121010.99678398.069581-27698.651297
400 rows × 34 columns
print('The column for cumulative net profit. as follows:')
X_test.loc[:,'Cumulate_net_profit']
The column for cumulative net profit. as follows:

972     -487.074435
334     -964.117360
728    -1434.421542
59     -1900.553622
11     -2355.853706
           ...

519   -28084.173974
135   -27988.435915
567   -27892.649194
156   -27796.720878
209   -27698.651297
Name: Cumulate_net_profit, Length: 400, dtype: float64
Q4.d
How far into the test data do you go to get maximum net profit? (Often this is specified as a percentile or rounded to deciles.)
plt.bar(np.arange(31),clf.coef_.reshape(-1))
plt.xlabel('Variables')
plt.ylabel('Weight')
plt.show()
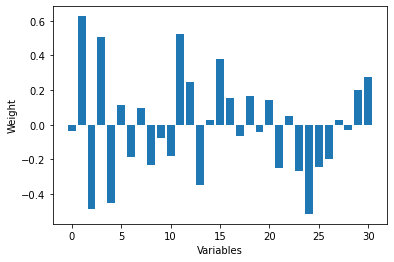
In order to maximize net profit, the “predictive success probability” of the test data is critical.
The results of the model show that the checking account status has a significant positive effect on the probability of success, while the duration of credit and the purpose of credit have a negative effect on the probability of success
Q4.e
If this logistic regression model is scored to future applicants, what “probability of success” cutoff should be used in extending credit?
X_test.iloc[int((5/6)*400),-3]
0.9578759345718599
In order to reduce the cost of extending credit, balance risks and benefits.Here we propose to set up a reasonable “probability of success” cutoff point so that the number of successful people should be greater than or equal to five times the number of unsuccessful people.This means that 5/6 of all people should be below the probability of success. By calculation, I think the “probability of success” cutoff point should be set at 0.95
Original: https://blog.csdn.net/GODSuner/article/details/115029101
Author: 春风惹人醉
Title: Logstic Regression模型对German Credit数据集进行分类
原创文章受到原创版权保护。转载请注明出处:https://www.johngo689.com/667249/
转载文章受原作者版权保护。转载请注明原作者出处!