

提供的api说明displotFigure-level interface for drawing distribution plots onto a FacetGrid. 图形级界面,用于在FacetGrid上绘制分布图。histplotPlot univariate or bivariate histograms to show distributions of datasets. 绘制单变量或双变量直方图来显示数据集的分布。kdeplotPlot univariate or bivariate distributions using kernel density estimation. 使用核密度估计绘制单变量或双变量分布ecdfplotPlot empirical cumulative distribution functions.绘制经验累积分布函数。rugplotPlot marginal distributions by drawing ticks along the x and y axes. 通过在x和y轴上画刻度来绘制边缘分布。distplotDEPRECATED: Flexibly plot a univariate distribution of observations. :灵活地绘制观测数据的单变量分布。
displot
语法
seaborn.displot(data=Node,*, x=None, y=None, hue=None, row=None, col=None, weights=None, kind='hist',
rug=False, rug_kws=None, log_scale=None, legend=True, palette=None, hue_order=None, hue_norm=None,
color=None, col_wrap=None, row_order=None, col_order=None, height=5, aspect=1, facet_kws=None, **kwargs)
这个函数提供了几种可视化数据的单变量或双变量分布的方法,包括通过语义映射和跨多个子图分面定义的数据子集。
通过kind参数,选择不同的方法:
- histplot()
- kedplot()
- edfplot()
此外,可以将rugplot()添加到任何类型的图中以显示单个的观察结果。
参数说明
- data是输入的数据集,数据类型可以是pandas.DataFrame对象、numpy.ndarray数组、映射或序列类型等。
- x和y是参数data中的键或向量,指定关系图中x轴和y轴的变量。
- hue也是data中的键或向量,根据hue变量对数据进行分组,并在图中使用不同颜色的元素加以区分。
- hue_order指定色调语义的分类级别的处理和绘图顺序。
- hue_norm可以是设置数据单元规范化范围的一对值,也可以是将数据单元映射到[0,1]区间的对象。 使用意味着数字映射。
- size也是data中的键或向量,根据size变量控制图中点的大小或线条的粗细。
- style也是data中的键或向量,根据style变量对数据进行分组,并在图中使用不同类型的元素加以区分,比如点线、虚线等。
- kind指定要绘制的关系图类型,可选”scatter”(散点图)和”line”(线形图),默认值为”scatter”。
举例
penguins = sns.load_dataset("penguins")
sns.displot(data=penguins, x="flipper_length_mm")


使用kind=’kde’参数来显示核密度估计,(kernel density estimates);

使用kind=’ecdf’参数来显示经验累积分布函数(empirical cumulative distribution functions)

同时也可以在直方图中,显示核密度估计

绘制一个二元分析图,将x和y都赋值:
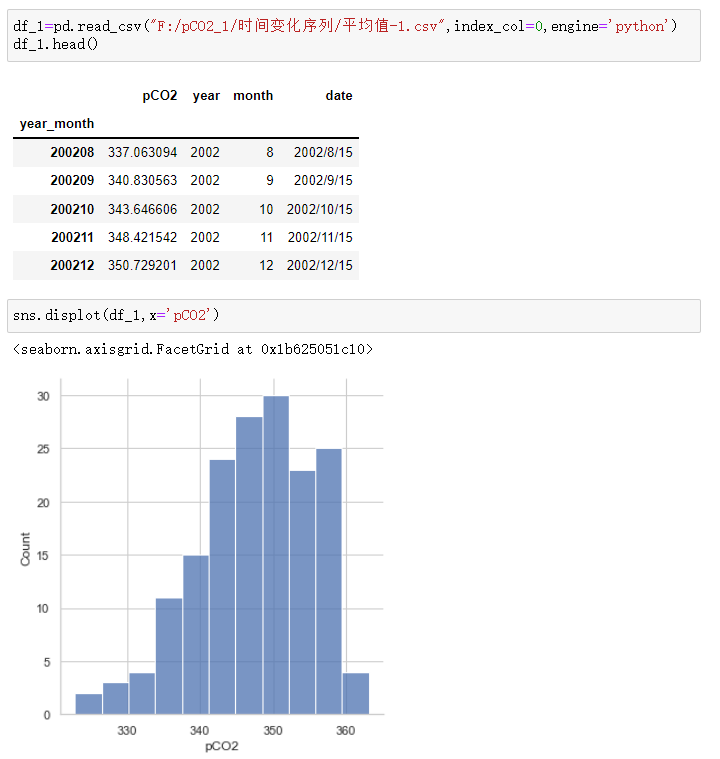
这幅图片里面内容不是很有意义,但是也能看得出pCO2值与year的变化与分布;


每种图都可以使用hue参数 映射为数据的子集单独绘制:使用的数据中有空值,所以加上了warn_singular。

可以再加上一些参数,来是的画的更好看;
multiple must be one of [‘layer’, ‘stack’, ‘fill’, ‘dodge’]
使用col参数来分图画;这里使用官网的数据源;

你可以通过height 和 aspect参数来控制它的大小和形状:

设置x、y轴 的命名 和单位;设置子标题命名

关于其他函数的讲解
还有其他API:histplot,kdeplot。。。读者可以参考下面网址。
这些画图工具能画出来太多的图了,但是基本上用法大家都清楚。
https://seaborn.pydata.org/api.html#categorical-plots
Original: https://blog.csdn.net/weixin_48562666/article/details/123553802
Author: 格局不能小
Title: seaborn库学习—-分布图displot、histplot、kdeplot、ecdfplot
原创文章受到原创版权保护。转载请注明出处:https://www.johngo689.com/648011/
转载文章受原作者版权保护。转载请注明原作者出处!