

桓峰基因公众号推出基于基因组变异数据生信分析教程并配有视频在线教程,目前整理出来的教程目录如下:
DNA 1. Germline Mutation Vs. Somatic Mutation 傻傻分不清楚
DNA 2. SCI 文章中基因组变异分析神器之 maftools
DNA 3. SCI 文章中基因组变异分析神器之 maftools
DNA 4. SCI 文章中基因组的突变信号(maftools)
DNA 5. 基因组变异文件VCF格式详解
DNA 6. 基因组变异之绘制精美瀑布图(ComplexHeatmap)
最近刚好在做项目,就感觉maftools里面的瀑布图不是很好用,于是就改成使用ComplexHeatmap,利用oncoplot获得突变矩阵还是很方便的,如果没有maf文件那么就自己创造一个突变矩阵吧,也不是很麻烦!
前言
如果有maf格式的文件,可以直接oncoplot包绘制瀑布图,有多种展示和统计maftools | 从头开始绘制发表级oncoplot(瀑布图)和maftools|TCGA肿瘤突变数据的汇总,分析和可视化,如果只有多个样本的基因突变与否的excel,不用担心,也可以用complexheatmap包绘制。
参数介绍
ComplexHeatmap这个包功能很强大,本次只简单地介绍如何绘制基因组景观图(瀑布图)。参数也非常的多,需要我们自己设计一些图形传入的数据,比如突变矩阵,颜色,legend的数据以及不同位置。另外oncoPrint也可以与draw这个函数并用,完美的设计自己觉着不错的图形用于文章中非常棒,一般来说凡是有复杂一些的突变瀑布图都是使用ComplexHeatmap软件包绘制处理的,别老是用oncoplot,毕竟灵活性不足而且不好对连续变量进行展示。下面主要简单说一下oncoPrint用到的几个参数:
mat: The value should be a character matrix which encodes mulitple alterations or a list of matrices for which every matrix contains binary value representing whether the alteration is present or absent. When the value is a list, the names of the list represent alteration types. You can use unify_mat_list to make all matrix having same row names and column names.
alter_fun: A single function or a list of functions which defines how to add graphics for different alterations. You can use alter_graphic to automatically generate for rectangles and points.
alter_fun_is_vectorized:Whether alter_fun is implemented vectorized. Internally the function will guess.
col:A vector of color for which names correspond to alteration types.
top_annotation:Annotation put on top of the oncoPrint. By default it is barplot which shows the number of genes with a certain alteration in each sample.
right_annotation:Annotation put on the right of the oncoPrint. By default it is barplot which shows the number of samples with a certain alteration in each gene.
left_annotation:Annotation put on the left of the oncoPrint.
bottom_annotation:Annotation put at the bottom of the oncoPrint.
heatmap_legend_param:pass to Heatmap.
实例解析
安装ComplexHeatmap软件包并加载,我们这里是使用maftools获得的突变矩阵,非常方便,一会教大家怎么使用。
1. 软件包安装
if (!require(maftools)) BiocManager::install("maftools")
if (!require(ComplexHeatmap)) BiocManager::install("ComplexHeatmap")

library(maftools)
library(ComplexHeatmap)
2. 数据读取
举例的数据就是LAML的数据集,在TCGA数据库上也有,但是我这里是使用maftools自带的例子数据,方便一些,获取突变矩阵只需要在oncoplot函数设置参数writeMatrix = TRUE,就会自动生成一个文件名为”onco_matrix.txt”的突变矩阵文件了,简单吧,不过前提条件是我们有maf格式文件,如果没有自己搞一个突变矩阵吧,行名为基因,列名为样本即可。
laml.maf = system.file("extdata", "tcga_laml.maf.gz", package = "maftools")
clinical information containing survival information and histology. This is
optional
laml.clin = system.file("extdata", "tcga_laml_annot.tsv", package = "maftools")

laml = read.maf(maf = laml.maf, clinicalData = laml.clin)
## -Reading
## -Validating
## -Silent variants: 475
## -Summarizing
## -Processing clinical data
## -Finished in 3.190s elapsed (0.450s cpu)
matMut <- read.table("onco_matrix.txt", header="T," check.names="F," sep="\t" ) matmut[1:3, 1:3] ## tcga-ab-2945 tcga-ab-2965 tcga-ab-2993 flt3 missense in-frame dnmt3a truncating npm1 < code></->
绘制瀑布图
接下来我们需要查看突变有哪几种类型,方便我们设置相应的图形大小,颜色等。我们看到共4种突变类型,那么就按照这四种突变开始设计图形等参数。
library(reshape2)
matMut[matMut == "In-frame"] = "In_frame"
matMuttmp = matMut
matMuttmp$gene = row.names(matMuttmp)
mat_long <- melt(matmuttmp, id.vars="gene" , value.name="Variant_Classification" ) levels(factor(mat_long$variant_classification)) ## [1] "" "in_frame" "missense" "multi_hit" "truncating" < code></->
1. 临床数据整理
临床信息需要我们区分连续型变量、离散型变量还是分类变量,这样在设置legend时颜色的筛选有非常大的不同。
pdata <- 1 2 3 4 5 8 164 181 365 577 945 2557 getclinicaldata(laml) pdata <- subset(pdata, pdata$tumor_sample_barcode %in% colnames(matmut)) pdata$days_to_last_followup="ifelse(pdata$days_to_last_followup" =="-Inf" , 0, pdata$days_to_last_followup) # 画图并去除无突变的样本和基因 pdata$fab_classification="factor(pdata$FAB_classification)" pdata$overall_survival_status="factor(pdata$Overall_Survival_Status)" str(pdata) ## 'data.frame': obs. of variables: $ tumor_sample_barcode : chr "tcga-ab-2802" "tcga-ab-2804" "tcga-ab-2805" "tcga-ab-2806" ... fab_classification factor w levels "m0","m1","m2",..: days_to_last_followup num overall_survival_status: "0","1": matmut matmut[, pdata$tumor_sample_barcode] < code></->
2. 指定变异形状
指定变异的形状,x,y,w,h代表变异的位置(x,y)和宽度(w),高度(h)
alter_fun <- list( background="function(x," y, w, h) { grid.rect(x, w-unit(0.5, "mm"), h-unit(0.5, gp="gpar(fill" = "white", col="NA))" }, in_frame="function(x," col["in_frame"], missense="function(x," col["missense"], multi_hit="function(x," col["multi_hit"], truncating="function(x," col["truncating"], } # splice_site="function(x," "mm"),h-unit(0.5, col["splice_site"], #} ) < code></->
3. 指定变异类型的标签,和数据中的类型对应
heatmap_legend_param <- list(title="Alternations" , at="c("In_frame"," "missense", "truncating", "multi_hit"), labels="c("In_frame"," "multi_hit")) < code></->
4. 指定颜色
指定颜色包括热图突变类型的颜色以及样本注释的颜色,基因注释的颜色等,我们这里只对突变类型和样本信息注释的颜色。
指定颜色, 调整颜色代码即可
col <- c(in_frame="purple" , missense="orange" multi_hit="black" truncating="blue" ) # 定义注释信息 自定义颜色 连续性变量设置颜色(外) library(circlize) col_os="colorRamp2(c(0," 973), c("white", "red")) < code></->
5. 设置样本注释
通过HeatmapAnnotation函数设置样本的注释信息,如下:
ha <- heatmapannotation(os="pdata$days_to_last_followup," status="pdata$Overall_Survival_Status," fab_classification="pdata$FAB_classification," col="list(OS" = col_os), show_annotation_name="TRUE," annotation_name_gp="gpar(fontsize" 7)) < code></->
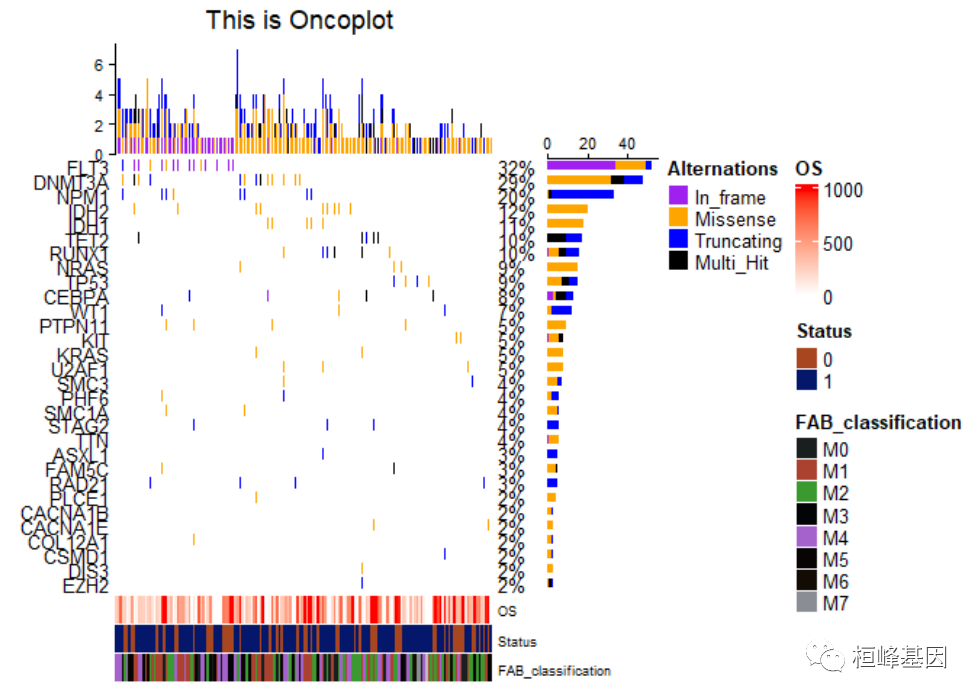
6. 设定标题
column_title <- "this is oncoplot " < code></->
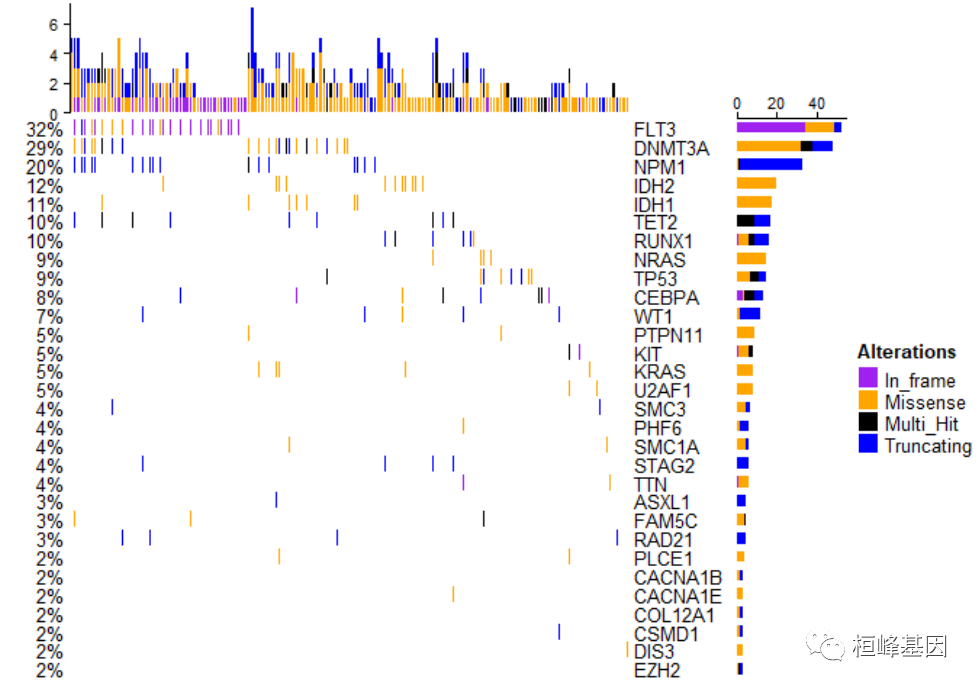
7. 简单瀑布图
简单瀑布图只包括热图部分,legend就是突变类型,如下:
oncoPrint(matMut, alter_fun = alter_fun, col = col, alter_fun_is_vectorized = FALSE)

8. 添加注释
添加样子注释结果,如下:
oncoPrint(matMut,
                        bottom_annotation = ha, #注释信息在底部
                     #   top_annotation=top_annotation,
                        #right_annotation=NULL,
                        alter_fun = alter_fun,
                        col = col,
                        column_title = column_title,
                        heatmap_legend_param = heatmap_legend_param,
                        row_names_side = "left",
                        pct_side = "right",
                       # column_order=sample_order,
                        #       column_split=3
          alter_fun_is_vectorized = FALSE
)
9. 调整注释的位置
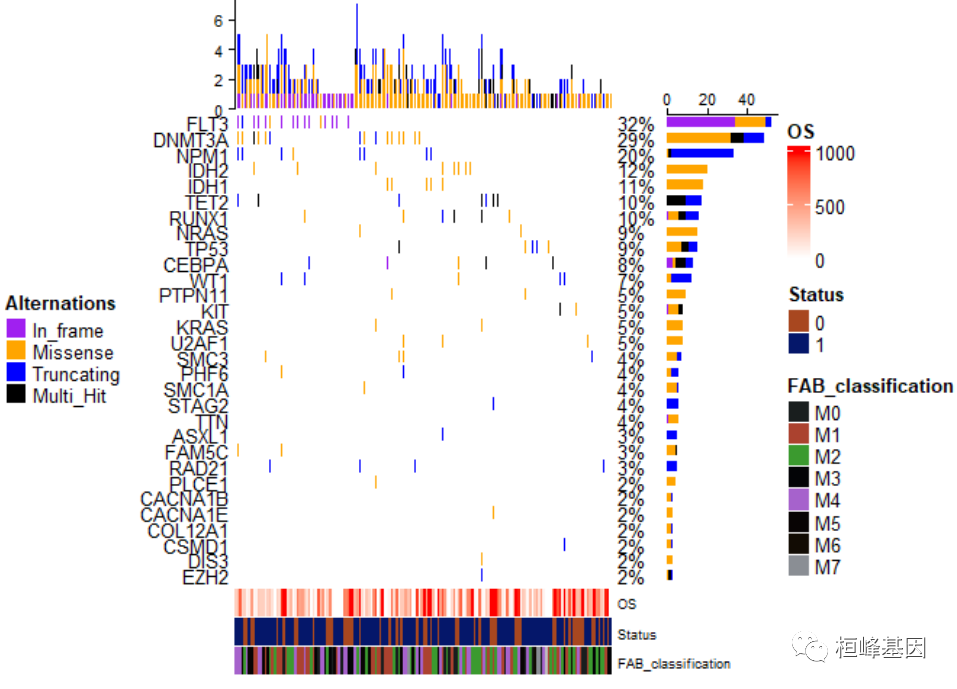
瀑布图提供三种注释方式,一种就是突变类型的注释,而另一种就是样本注释,当然基因也可以注释,而注释的位置需要根据draw给出来的参数自行调整,放在瀑布图的上下左右等四个位置,举几个例子稍微说明一下。首先是通过oncoPrint函数获得绘图参数,如下:
oncoplot_anno <- oncoprint(matmut, bottom_annotation="ha," #注释信息在底部 # top_annotation="top_annotation," #right_annotation="NULL," alter_fun="alter_fun," col="col," column_title , heatmap_legend_param="heatmap_legend_param," row_names_side="left" pct_side="right" column_order="sample_order," column_split="3" alter_fun_is_vectorized="FALSE" ) < code></->
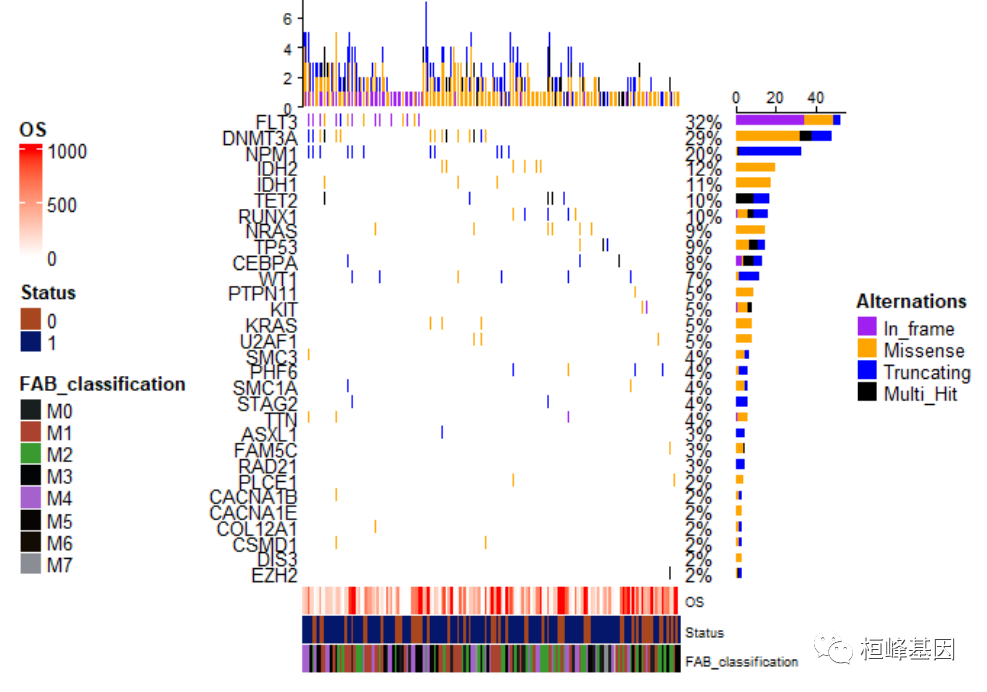
将样本的注释放在左边,如下:
draw(oncoplot_anno, annotation_legend_side = "left", )
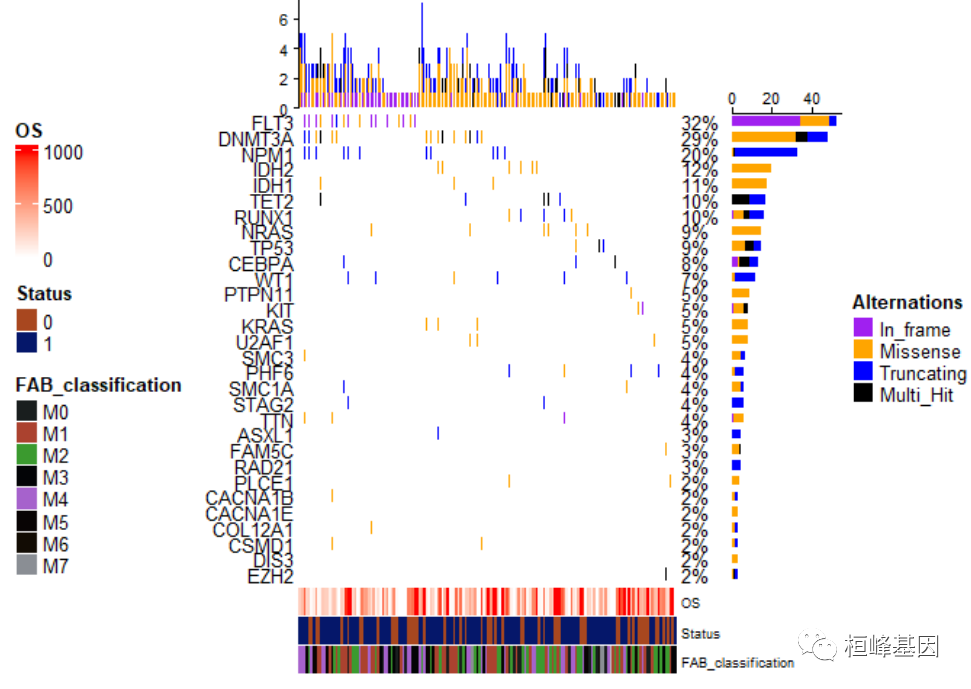
样本注释放在左边位置,而突变类型也就是热图注释放在右边,如下:
draw(oncoplot_anno, annotation_legend_side = "left", heatmap_legend_side = "right")
调整位置与上面位置正好相反,如下:
draw(oncoplot_anno, annotation_legend_side = "right", heatmap_legend_side = "left",
    )
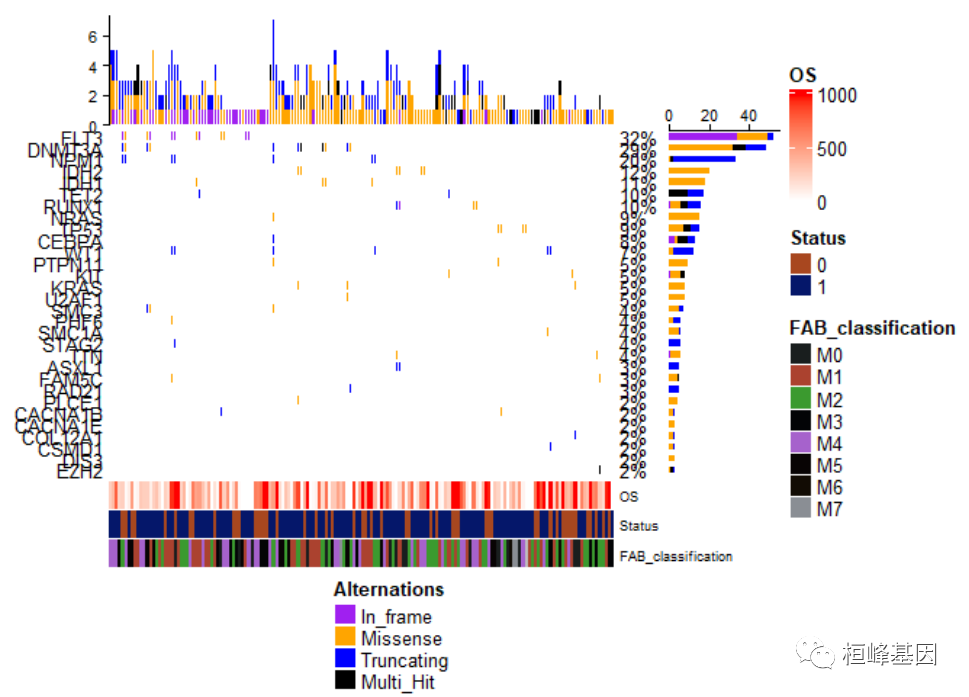
将热图注释放在瀑布图的最下面,并通过参数align_heatmap_legend调整位于中央位置,如下:
draw(oncoplot_anno, annotation_legend_side = "right", heatmap_legend_side = "bottom",
    align_heatmap_legend = "global_center")
总之根据自己的感觉,喜欢怎么设计就怎么搞起来就可以了,记住以后不是只能用maftools包里面的oncoplot绘制瀑布图哦!
Original: https://blog.csdn.net/weixin_41368414/article/details/125174493
Author: 桓峰基因
Title: DNA 6. 基因组变异之绘制精美瀑布图(ComplexHeatmap)
原创文章受到原创版权保护。转载请注明出处:https://www.johngo689.com/639709/
转载文章受原作者版权保护。转载请注明原作者出处!