

The PRISM daily and monthly datasets are gridded climate datasets for the conterminous United States, produced by the PRISM Climate Group at Oregon State University. Grids are developed using PRISM (Parameter-elevation Regressions on Independent Slopes Model). PRISM interpolation routines simulate how weather and climate vary with elevation, and account for coastal effects, temperature inversions, and terrain barriers that can cause rain shadows. Station data are assimilated from many networks across the country. For more information, see the Descriptions of PRISM Spatial Climate Datasets.
Note
-
Warning, this dataset should not be used to calculate century-long climate trends due to non-climatic variations from to station equipment and location changes, openings and closings, varying observation times, and the use of relatively short-term networks. Please see the dataset documentation for more details.
-
It takes time for observation networks to conduct quality control and release station data. Therefore, PRISM datasets are re-modeled several times until six months have elapsed, when they are considered permanent. A release schedule is available.
-
For use of the 30 arc-second (~800 m) version of this dataset please contact the provider at prism-questions@nacse.org.
PRISM日数据集和月数据集是美国本土的网格化气候数据集,由俄勒冈州立大学的PRISM气候小组制作。网格是使用PRISM(独立坡度模型的参数-海拔回归)开发的。PRISM插值程序模拟了天气和气候如何随海拔变化,并考虑了海岸效应、温度反转和可能导致雨影的地形障碍。站点数据来自全国各地的许多网络。欲了解更多信息,请参见PRISM空间气候数据集的描述。
注意
警告,这个数据集不应该被用来计算一个世纪的气候趋势,因为非气候的变化来自于台站设备和位置的变化,开放和关闭,不同的观测时间,以及使用相对短期的网络。更多细节请见数据集文件。
观测网络需要时间来进行质量控制和发布站点数据。因此,PRISM数据集会被重新建模数次,直到六个月后被认为是永久性的。有一个发布时间表。
如需使用该数据集的30弧秒(~800米)版本,请与提供者联系,prism-questions@nacse.org。
Dataset Availability
1895-01-01T00:00:00 – 2021-08-01T00:00:00
Dataset Provider
Collection Snippet
ee.ImageCollection("OREGONSTATE/PRISM/AN81m")
Resolution
4638.3 meters
Bands Table
NameDescriptionMinMaxUnitspptMonthly total precipitation (including rain and melted snow)02639.82mmtmeanMonthly average of daily mean temperature (calculated as (tmin+tmax)/2)-30.841.49°CtminMonthly minimum temperature-35.1134.72°CtmaxMonthly average of daily maximum temperature-29.849.74°CtdmeanMonthly average of daily mean dew point temperature-30.726.76°CvpdminMonthly average of daily minimum vapor pressure deficit044.79hPavpdmaxMonthly average of daily maximum vapor pressure deficit0.009110.06hPa
- = Values are estimated
影像属性:
NameTypeDescriptionPRISM_CODE_VERSIONList of StringsList of code versions per-band, e.g: the first element is for the first band “ppt”, the second element is for the second band “tmean”PRISM_DATASET_CREATE_DATEList of StringsList of original creation dates per-bandPRISM_DATASET_FILENAMEList of StringsList of original filenames for each bandPRISM_DATASET_TYPEList of StringsList of dataset types per-bandPRISM_DATASET_VERSIONList of StringsList of dataset versions per-band e.g: D1 or D2 for daily products; M1, M2 or M3 for monthly products.statusStringData generated within 30 days of observation have the status “early”. Data generated within 1-6 months of observation may have the status “provisional” and data older than 6 months are marked as “permanent”.
引用:
[Daly, C., J.I. Smith, and K.V. Olson. 2015. Mapping atmospheric moisture climatologies across the conterminous United States. PloS ONE 10(10):e0141140. doi:10.1371/journal.pone.0141140.
代码:
var dataset = ee.ImageCollection('OREGONSTATE/PRISM/AN81m')
.filter(ee.Filter.date('2018-07-01', '2018-07-31'));
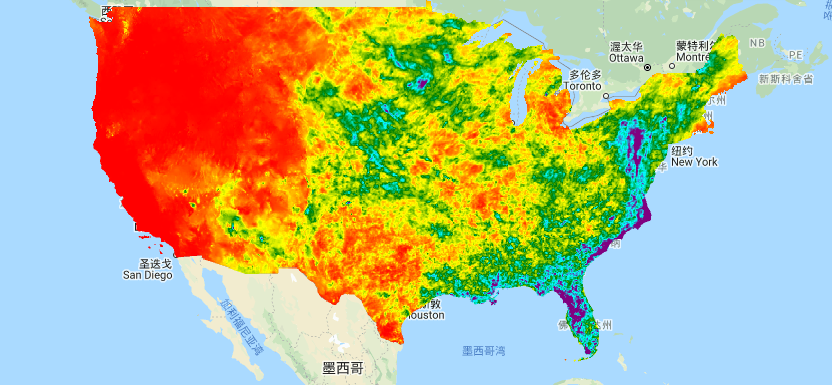
var precipitation = dataset.select('ppt');
var precipitationVis = {
min: 0.0,
max: 300.0,
palette: ['red', 'yellow', 'green', 'cyan', 'purple'],
};
Map.setCenter(-100.55, 40.71, 4);
Map.addLayer(precipitation, precipitationVis, 'Precipitation');

Original: https://blog.csdn.net/qq_31988139/article/details/120601301
Author: 此星光明
Title: Google Earth Engine——PRISM日数据集和月数据集是美国本土的网格化气候数据集,由俄勒冈州立大学的PRISM气候小组制作。网格是使用PRISM(独立坡度模型的参数-海拔回归)开发的
原创文章受到原创版权保护。转载请注明出处:https://www.johngo689.com/635773/
转载文章受原作者版权保护。转载请注明原作者出处!