

1. 随机森林-分类任务
我们使用随机森林完成鸢尾花分类任务:
第一步,导入我们可能需要的包:
from sklearn.datasets import load_iris
from sklearn.model_selection import train_test_split
from sklearn.ensemble import RandomForestClassifier
import numpy as np
from matplotlib.colors import ListedColormap
import matplotlib.pyplot as plt
接下来,我们展示一下数据集,主要看一下数据的维度和特征::
iris=load_iris()
iris.feature_names
['sepal length (cm)',
 'sepal width (cm)',
 'petal length (cm)',
 'petal width (cm)']
data=iris.data
data


我们有四列数据,分别对应四个特征。
我们看一下标签数据:
target=iris.target
target

我们看一下标签的种类:
np.unique(target)

总共分三类。
我们选取后两个特征来分类: 'petal length (cm)', 'petal width (cm)'
X = iris.data[:,[2,3]]
y = iris.target
print('Class labels:', np.unique(y))
X_train, X_test, y_train, y_test = train_test_split(X, y, test_size=0.3, random_state=1, stratify=y)
print(X_train.shape, y_train.shape)
我们看一下数据信息:
Class labels: [0 1 2]
(105, 2) (105,)
我们进行训练,并绘制分类决策边界:
def plot_decision_regions(X, y, classifier, test_idx=None, resolution=0.02):

     markers = ('s', 'x', 'o', '^', 'v')
     colors = ('red', 'blue', 'lightgreen', 'gray', 'cyan')
     cmap = ListedColormap(colors[:len(np.unique(y))])

     x1_min, x1_max = X[:, 0].min() - 1, X[:, 0].max() + 1
     x2_min, x2_max = X[:, 1].min() - 1, X[:, 1].max() + 1
     xx1, xx2 = np.meshgrid(np.arange(x1_min, x1_max, resolution),
                            np.arange(x2_min, x2_max, resolution))
     Z = classifier.predict(np.array([xx1.ravel(), xx2.ravel()]).T)
     Z = Z.reshape(xx1.shape)
     plt.contourf(xx1, xx2, Z, alpha=0.3, cmap=cmap)
     plt.xlim(xx1.min(), xx1.max())
     plt.ylim(xx2.min(), xx2.max())

     for idx, cl in enumerate(np.unique(y)):
         plt.scatter(x=X[y == cl, 0], y=X[y == cl, 1],
         alpha=0.8, c=colors[idx],
         marker=markers[idx], label=cl,
         edgecolor='black')

     if test_idx:

         X_test, y_test = X[test_idx, :], y[test_idx]
         plt.scatter(X_test[:, 0], X_test[:, 1],
                     c='white', edgecolor='black', alpha=1.0,
                     linewidth=1, marker='o',
                     s=100, label='test set')
forest = RandomForestClassifier(criterion='gini',
                                n_estimators=25,
                                random_state=1,
                                n_jobs=2)
forest.fit(X_train, y_train)
X_combined = np.vstack((X_train, X_test))
y_combined = np.hstack((y_train, y_test))
plot_decision_regions(X_combined, y_combined, classifier=forest, test_idx=range(105,150))
plt.xlabel('petal length')
plt.ylabel('petal width')
plt.legend(loc='upper left')
plt.show()
我们的输出结果为:

2. 随机森林-特征重要性
我们首先看一下数据集:
cwd = './Machine_Learning/'
data_dir = cwd+'RandomForest随机森林/data/'

df_wine = pd.read_csv(data_dir+'wine.data',
                      header=None,
                      names=['Class label', 'Alcohol', 'Malic acid', 'Ash', 'Alcalinity of ash', 'Magnesium',
                               'Total phenols', 'Flavanoids', 'Nonflavanoid phenols', 'Proanthocyanins', 'Color intensity',
                               'Hue', 'OD280/OD315 of diluted wines', 'Proline'])
print('Class labels', np.unique(df_wine['Class label']))
print('numbers of features:', len(df_wine.keys())-1)
df_wine.head()
下面展示部分结果:

由此可知,数据集为白酒数据,共有13个特征。
接下来我们划分训练集和测试集:
X, y = df_wine.iloc[:, 1:].values, df_wine.iloc[:, 0].values
X_train, X_test, y_train, y_test = train_test_split(X, y, test_size=0.3, random_state=0, stratify=y)
X_train.shape
(124, 13)
使用RandomForestClassifier训练,然后调用 feature_importances_属性获得特征重要性:
feat_labels = df_wine.columns[1:]
forest = RandomForestClassifier(n_estimators=200, random_state=1)
forest.fit(X_train, y_train)
importances = forest.feature_importances_
print(len(importances))
importances

我们排一下顺序:
indices = np.argsort(importances)[::-1]
indices
numpy.argsort(a, axis=-1, kind=’quicksort’, order=None) 功能:
将矩阵a在指定轴axis上排序,并返回排序后的下标
参数: a:输入矩阵, axis:需要排序的维度
返回值: 输出排序后的下标

for i in range(X_train.shape[1]):
    print("%2d) %-*s %f" % (i + 1, 30, feat_labels[indices[i]], importances[indices[i]]))
我们看一下最终的结果为:
1) Proline                        0.194966
 2) Flavanoids                     0.187939
 3) Color intensity                0.134887
 4) OD280/OD315 of diluted wines   0.134407
 5) Alcohol                        0.115360
 6) Hue                            0.063459
 7) Total phenols                  0.040195
 8) Magnesium                      0.032550
 9) Proanthocyanins                0.026119
10) Malic acid                     0.024860
11) Alcalinity of ash              0.020615
12) Ash                            0.013679
13) Nonflavanoid phenols           0.010963
我们可视化一下结果:
plt.title('Feature Importance')
plt.bar(range(X_train.shape[1]), importances[indices], align='center')
plt.xticks(range(X_train.shape[1]), feat_labels[indices], rotation=90)
plt.xlim([-1, X_train.shape[1]])
plt.tight_layout()
plt.show()

3. 随机森林-回归任务
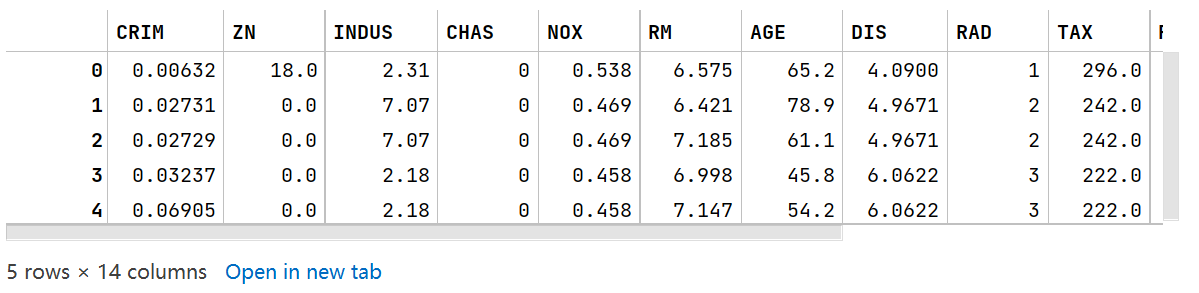
展示一下数据集:
from sklearn.ensemble import RandomForestRegressor
from sklearn.metrics import mean_squared_error

df = pd.read_csv(data_dir+'housing.data.txt',
                 header=None,
                 sep='\s+',
                 names= ['CRIM', 'ZN', 'INDUS', 'CHAS', 'NOX', 'RM', 'AGE', 'DIS', 'RAD', 'TAX', 'PTRATIO', 'B', 'LSTAT', 'MEDV'])
df.head()
X = df.iloc[:, :-1].values
y = df['MEDV'].values
X_train, X_test, y_train, y_test =train_test_split(X, y, test_size=0.2, random_state=1)
print(X_train.shape, y_train.shape)
(404, 13) (404,)
forest = RandomForestRegressor(n_estimators=100, criterion='mse', random_state=1, n_jobs=-1)
forest.fit(X_train, y_train)

y_train_pred = forest.predict(X_train)
y_test_pred = forest.predict(X_test)
print('MSE train: %.3f, test: %.3f' % (mean_squared_error(y_train, y_train_pred), mean_squared_error(y_test, y_test_pred)))
最终结果为:
MSE train: 1.237, test: 8.916
4. 源代码
from sklearn import datasets
from sklearn.model_selection import train_test_split
from sklearn.ensemble import RandomForestClassifier
import numpy as np

from matplotlib.colors import ListedColormap
import matplotlib.pyplot as plt

iris = datasets.load_iris()
print(iris['data'].shape, iris['target'].shape)
X = iris.data[:,[2,3]]
y = iris.target
print('Class labels:', np.unique(y))
X_train, X_test, y_train, y_test = train_test_split(X, y, test_size=0.3, random_state=1, stratify=y)
print(X_train.shape, y_train.shape)
def plot_decision_regions(X, y, classifier, test_idx=None, resolution=0.02):

     markers = ('s', 'x', 'o', '^', 'v')
     colors = ('red', 'blue', 'lightgreen', 'gray', 'cyan')
     cmap = ListedColormap(colors[:len(np.unique(y))])

     x1_min, x1_max = X[:, 0].min() - 1, X[:, 0].max() + 1
     x2_min, x2_max = X[:, 1].min() - 1, X[:, 1].max() + 1
     xx1, xx2 = np.meshgrid(np.arange(x1_min, x1_max, resolution),
                            np.arange(x2_min, x2_max, resolution))
     Z = classifier.predict(np.array([xx1.ravel(), xx2.ravel()]).T)
     Z = Z.reshape(xx1.shape)
     plt.contourf(xx1, xx2, Z, alpha=0.3, cmap=cmap)
     plt.xlim(xx1.min(), xx1.max())
     plt.ylim(xx2.min(), xx2.max())

     for idx, cl in enumerate(np.unique(y)):
         plt.scatter(x=X[y == cl, 0], y=X[y == cl, 1],
         alpha=0.8, c=colors[idx],
         marker=markers[idx], label=cl,
         edgecolor='black')

     if test_idx:

         X_test, y_test = X[test_idx, :], y[test_idx]
         plt.scatter(X_test[:, 0], X_test[:, 1],
                     c='', edgecolor='black', alpha=1.0,
                     linewidth=1, marker='o',
                     s=100, label='test set')
               forest = RandomForestClassifier(criterion='gini',
                                n_estimators=25,
                                random_state=1,
                                n_jobs=2)
forest.fit(X_train, y_train)
X_combined = np.vstack((X_train, X_test))
y_combined = np.hstack((y_train, y_test))
plot_decision_regions(X_combined, y_combined, classifier=forest, test_idx=range(105,150))
plt.xlabel('petal length')
plt.ylabel('petal width')
plt.legend(loc='upper left')
plt.show()
import pandas as pd
import numpy as np
from sklearn.ensemble import RandomForestClassifier
from sklearn.model_selection import train_test_split

import matplotlib.pyplot as plt

cwd = './MachineLearning/'
data_dir = cwd+'RandomForest随机森林/data/'

df_wine = pd.read_csv(data_dir+'wine.data',
                      header=None,
                      names=['Class label', 'Alcohol', 'Malic acid', 'Ash', 'Alcalinity of ash', 'Magnesium',
                               'Total phenols', 'Flavanoids', 'Nonflavanoid phenols', 'Proanthocyanins', 'Color intensity',
                               'Hue', 'OD280/OD315 of diluted wines', 'Proline'])
print('Class labels', np.unique(df_wine['Class label']))
print('numbers of features:', len(df_wine.keys())-1)
df_wine.head()

X, y = df_wine.iloc[:, 1:].values, df_wine.iloc[:, 0].values
X_train, X_test, y_train, y_test = train_test_split(X, y, test_size=0.3, random_state=0, stratify=y)
X_train.shape

feat_labels = df_wine.columns[1:]
forest = RandomForestClassifier(n_estimators=200, random_state=1)
forest.fit(X_train, y_train)
importances = forest.feature_importances_
print(len(importances))
importances

indices = np.argsort(importances)[::-1]
indices

for i in range(X_train.shape[1]):
    print("%2d) %-*s %f" % (i + 1, 30, feat_labels[indices[i]], importances[indices[i]]))

plt.title('Feature Importance')
plt.bar(range(X_train.shape[1]), importances[indices], align='center')
plt.xticks(range(X_train.shape[1]), feat_labels[indices], rotation=90)
plt.xlim([-1, X_train.shape[1]])
plt.tight_layout()
plt.show()
from sklearn.ensemble import RandomForestRegressor
from sklearn.metrics import mean_squared_error

df = pd.read_csv(data_dir+'housing.data.txt',
                 header=None,
                 sep='\s+',
                 names= ['CRIM', 'ZN', 'INDUS', 'CHAS', 'NOX', 'RM', 'AGE', 'DIS', 'RAD', 'TAX', 'PTRATIO', 'B', 'LSTAT', 'MEDV'])
df.head()

X = df.iloc[:, :-1].values
y = df['MEDV'].values
X_train, X_test, y_train, y_test =train_test_split(X, y, test_size=0.2, random_state=1)
print(X_train.shape, y_train.shape)

forest = RandomForestRegressor(n_estimators=100, criterion='mse', random_state=1, n_jobs=-1)
forest.fit(X_train, y_train)

y_train_pred = forest.predict(X_train)
y_test_pred = forest.predict(X_test)
print('MSE train: %.3f, test: %.3f' % (mean_squared_error(y_train, y_train_pred), mean_squared_error(y_test, y_test_pred)))
Original: https://blog.csdn.net/wzk4869/article/details/126652944
Author: 旅途中的宽~
Title: 随机森林实战(分类任务+特征重要性+回归任务)(含Python代码详解)
原创文章受到原创版权保护。转载请注明出处:https://www.johngo689.com/626735/
转载文章受原作者版权保护。转载请注明原作者出处!