

一、K-means简介
K-means是机器学习中常见的一种非监督学习分类算法,主要是对一个不带标签的数据集进行相似性分析,进而将其分成若干类。
二、一些基本概念
- “距离”:我们通常是使用欧式距离来衡量两个样本间的相似度,其计算公式为:
 , 其中,dij表示样本i和样本j的距离,m是特征数。
 - 簇:分出的每个类称为一个簇,其中簇的数量人为确定,一般用K表示,是一个超参数。
- 簇中心:簇中心是一个类整体特征的代表,其一般是整个类别中的所有样本取平均,其计算公式为:,其中Ck表示簇中心第k个特征的值,c为该簇总样本数。
三、算法基本步骤
- 从原始数据中随机选取K个样本作为初始簇中心
- 计算各样本与各簇中心的距离,并将其分到距离最近的簇
- 重新计算簇中心
- 重复步骤2,3直至簇中心不在发生变化
四、聚类结果评估
聚类完成之后,我们通常用轮廓系数来评估聚类结果的好坏,其计算公式为:
,其中ai,bi分别表示第i个样本的凝聚度和分散度。凝聚度用于衡量簇内样本的密集程度,分散度则用于衡量簇间的分散程度。ai的计算公式为:,其中dij表示同一簇内第i个样本与第j个样本的距离,c为该簇总样本量。而分散度计算方法与ai类似,将同一个簇改为不同的簇分别计算距离平均值取最小即可。最终结果取所有样本轮廓系数的平均值来衡量分类结果的好坏,其大小一般属于[-1,1]且越靠近1分类效果越好,越靠近-1分类效果越差。
五、python实现
import numpy as np
import matplotlib.pyplot as plt
class Kmeans:
def __init__(self):
# 原始数据
self.dataset = None
# 分类的簇数
self.K = None
# 分类结果
self.belongs = None
# 分类簇
self.piles = None
# 簇中心
self.centres = None
# 轮廓系数
self.sils = None
# 计算欧式距离
@staticmethod
def cal_Eu_dis(sample1, sample2):
sample1 = np.array(sample1, dtype=np.float32)
sample2 = np.array(sample2, dtype=np.float32)
assert sample1.shape == sample2.shape
dis = np.sqrt(np.sum((sample1 - sample2) ** 2))
return dis
# 计算单个簇的中心
@staticmethod
def cal_centre(category_data):
category_data = np.array(category_data, dtype=np.float32)
return np.mean(category_data, axis=0).reshape(1, -1)
# 计算每个簇的中心
def cal_centres(self):
self.piles = self.split_dataset()
self.centres = self.cal_centre(self.piles['pile0'])
for k in range(1, self.K):
category_data = self.piles['pile' + str(k)]
self.centres = np.concatenate((self.centres, self.cal_centre(category_data)), axis=0)
return self.centres
# 计算单个样本与各簇中心的距离
def cal_sample_centre(self, sample):
assert len(self.centres.shape) == 2
dis = []
for centre in self.centres:
dis.append(self.cal_Eu_dis(sample, centre))
return np.array(dis).reshape(1, -1)
# 计算整个个数据集与各簇中心的距离
def cal_dataset_centre(self):
sample = next(iter(self.dataset))
dis = self.cal_sample_centre(sample)
for sample in self.dataset[1:]:
dis = np.concatenate((dis, self.cal_sample_centre(sample)), axis=0)
return dis
# 计算单个样本的凝聚度
@staticmethod
def cal_sample_condensation(sample, pile):
sample = np.tile(sample, (len(pile), 1))
assert sample.shape == pile.shape
C = np.sum(np.sqrt(np.sum((sample - pile) ** 2, axis=1)))
return C / (len(pile) - 1)
# 计算整个数据集的凝聚度
def cal_dataset_condensation(self):
a = np.zeros(len(self.dataset), dtype=np.float32)
for k, data in enumerate(self.dataset):
pile = self.piles['pile' + str(int(self.belongs[k]))]
a[k] = self.cal_sample_condensation(data, pile)
return a
# 计算分离度
@staticmethod
def cal_sample_separation(sample, other_piles):
S = []
for pile in other_piles:
sample = np.tile(sample, (pile.shape[0], 1))
assert sample.shape == pile.shape
D = np.sum(np.sqrt(np.sum((sample - pile) ** 2, axis=1)))
S.append(D / (len(pile)))
sample = sample[0, :]
return np.min(S)
# 计算整个数据集的分离度
def cal_dataset_separation(self):
b = np.zeros(len(self.dataset), dtype=np.float32)
for k, data in enumerate(self.dataset):
# 起点---生成other_piles---起点
other_piles = []
for l in range(len(self.piles)):
if not np.equal(l, int(self.belongs[k])):
other_piles.append(self.piles['pile' + str(l)])
# 结束------结束
b[k] = self.cal_sample_separation(data, other_piles)
return b
def cal_dataset_silhouette_score(self):
a = self.cal_dataset_condensation()
b = self.cal_dataset_separation()
c = np.concatenate((a.reshape(-1, 1), b.reshape(-1, 1)), axis=1)
r = (b - a) / np.max(c, axis=1)
return np.sum(r) / len(r)
# 将整体数据集按簇划分
def split_dataset(self):
self.piles = {}
for k in range(self.K):
self.piles['pile' + str(k)] = self.dataset[np.where(self.belongs == k)[0]]
return self.piles
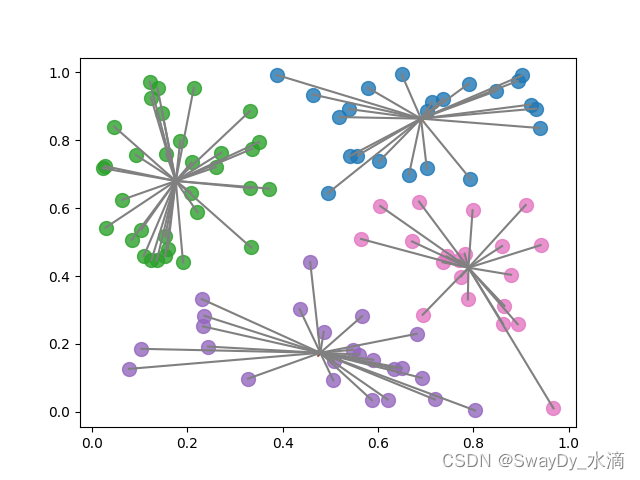
# 若是二维数据则可画图
def plot(self):
for i, category_data in enumerate(self.piles.values()):
plt.scatter(category_data[:, 0], category_data[:, 1], marker='o', s=100, alpha=0.8)
plt.scatter(self.centres[i, 0], self.centres[i, 1], marker='x', s=20, alpha=1)
centre = np.tile(self.centres[i], [len(category_data), 1])
plt.plot([centre[:, 0], category_data[:, 0]], [centre[:, 1], category_data[:, 1]], c='grey')
plt.show()
def __call__(self, dataset, K):
# 原始数据
self.dataset = dataset
# 分类的簇数
self.K = K
# 随机选取K个簇中心
self.centres = self.dataset[np.random.choice(self.dataset.shape[0], self.K, replace=False)]
pre_centres = np.zeros((self.K, self.dataset.shape[1]))
self.belongs = np.zeros((self.dataset.shape[0], 1))
while not np.equal(pre_centres, self.centres).all():
# 计算一个数据集中所有样本到簇中心的距离
distance = self.cal_dataset_centre()
# 更新样本所属簇
self.belongs = np.argmin(distance, axis=1).reshape(-1, 1)
# 保存原有簇中心
pre_centres = self.centres
# 重新计算簇中心
self.centres = self.cal_centres()
self.piles = self.split_dataset()
self.sils = self.cal_dataset_silhouette_score()
if dataset.shape[1] == 2:
self.plot()
return np.concatenate((self.dataset, self.belongs), axis=1)
主要的属性有分类结果belongs、分类簇piles、簇中心centres以及轮廓系数sils。需要传入的参数有原始数据dataset(数据结构为ndarray)和簇的数量K。
六、模型使用
我们可以随机生成100个样本,每个样本两个特征。接着实例化Kmeans类,生成结果result。(运行下列代码时记得导入前面的Kmeans类哟~)
def load_data():
    dataset = np.random.rand(100, 2)
    K = 4
    return dataset, K

dataset, K = load_data()
k = Kmeans()
result = k(dataset, K)
其他还有些细节我就不详细介绍了,大家可以自己去跑一些代码,实践出真知嘛。
Original: https://blog.csdn.net/ONLY_ME_CANTHIS/article/details/126769158
Author: SwayDy_水滴
Title: 数学建模笔记——K-means聚类(python实现)
原创文章受到原创版权保护。转载请注明出处:https://www.johngo689.com/619005/
转载文章受原作者版权保护。转载请注明原作者出处!