

如果你认为下面的图比较美观,尤其是标注文本与箭头的连接部分,理论上阅读本文会有所得。


; 一 Plt.annotate函数
参考官网:https://matplotlib.org/stable/api/_as_gen/matplotlib.pyplot.annotate.html
matplotlib.pyplot.annotate(text, xy, *args, **kwargs)。
- text:The text of the annotation.
注释文本的内容
* xy:The point (x, y) to annotate. The coordinate system is determined by xycoords
被指向的数据点(x,y)的位置坐标, 重要的是:这里的位置坐标值是参考 xycoords参数的值,它表示plot中的点要遵守的坐标系的类型。
* xytext:注释文本的坐标点,也是二维元组,默认与xy参数的值相同。
* xycoords:被注释点的坐标系属性,允许输入的值如下
* textcoords :注释文本的坐标系属性, 默认与xycoords属性值相同,也可设为不同的值。除了允许输入xycoords的属性值,还允许输入以下两种:ValueDescription’offset points’Offset (in points) from the xy value’offset pixels’Offset (in pixels) from the xy value
* arrowprops:箭头的样式,dict(字典)型数据。
用于在 xy 和 xytext 位置之间 绘制箭头的属性。 请注意,指向 xytext 的箭头边缘将以文本本身为中心,并且可能不会直接指向 xytext 中给出的坐标。
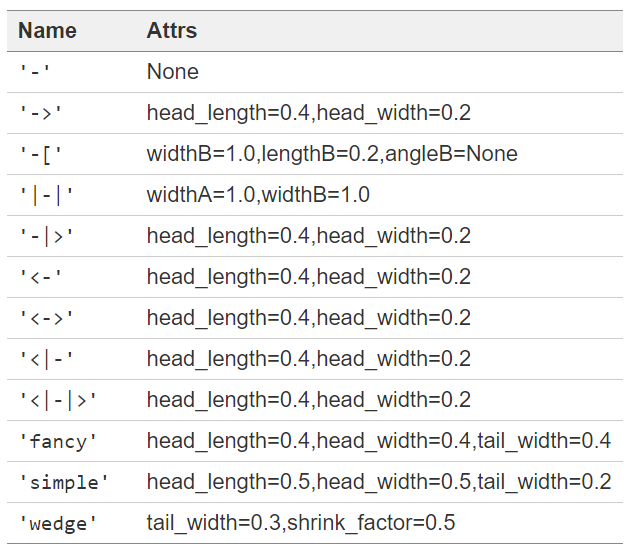
官网中指出,该字典参数的key值,会随着arrowstyle键的出现与否而不同,而arrowstyle意味着对箭头的定义:
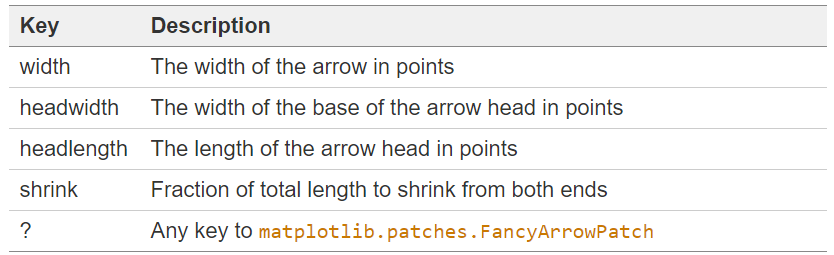
– 如果出现了arrowstyle键,则arrowstyle的值的可取值范围如下所示:
大家自行体验即可,适合自己数据的才是最好的。
以下是本人随机挑选的几个用于可视化。
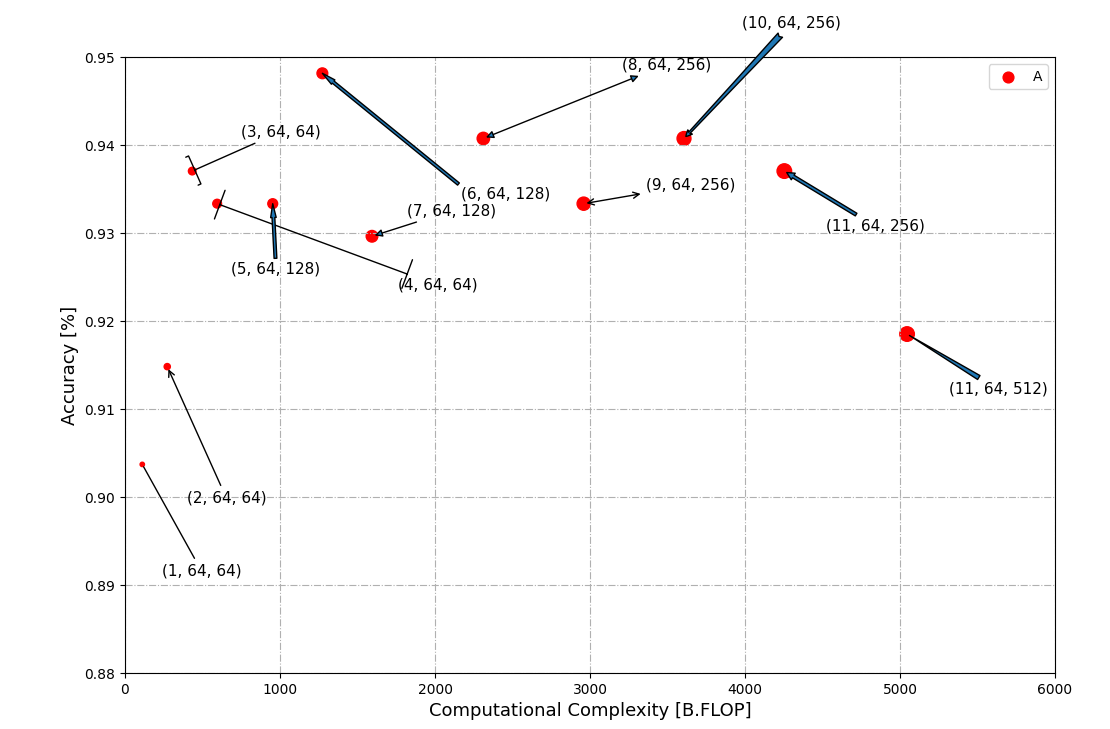
def flopsA_Anotation(flops_A):
    i = 0
    plt.annotate("{}".format(flops_A[2][i]), xy=(flops_A[0][i] * alpha, flops_A[1][i]), xytext=(14, -80),
                 fontsize=11, textcoords='offset points', xycoords="data",
                 arrowprops=dict(arrowstyle='-')
                 )
    i = 1
    plt.annotate("{}".format(flops_A[2][i]), xy=(flops_A[0][i] * alpha, flops_A[1][i]), xytext=(+14, -98),
                 fontsize=11, textcoords='offset points', xycoords="data",
                 arrowprops=dict(arrowstyle='->')
                 )
    i = 2
    plt.annotate("{}".format(flops_A[2][i]), xy=(flops_A[0][i] * alpha, flops_A[1][i]), xytext=(+35, +25),
                 fontsize=11, textcoords='offset points', xycoords="data",
                 arrowprops=dict(arrowstyle='-[')
                 )
    i = 3
    plt.annotate("{}".format(flops_A[2][i]), xy=(flops_A[0][i] * alpha, flops_A[1][i]), xytext=(+130, -62),
                 fontsize=11, textcoords='offset points', xycoords="data",
                 arrowprops=dict(arrowstyle='|-|')
                 )
    i = 4
    plt.annotate("{}".format(flops_A[2][i]), xy=(flops_A[0][i] * alpha, flops_A[1][i]), xytext=(-30, -50),
                 fontsize=11, textcoords='offset points', xycoords="data",
                 arrowprops=dict(width=2, headwidth=4, headlength=10, shrink=4)
                 )
    i = 5
    plt.annotate("{}".format(flops_A[2][i]), xy=(flops_A[0][i] * alpha, flops_A[1][i]), xytext=(+100, -90),
                 fontsize=11, textcoords='offset points', xycoords="data",
                 arrowprops=dict(width=2, headwidth=4, headlength=10, shrink=4)
                 )
    i = 6
    plt.annotate("{}".format(flops_A[2][i]), xy=(flops_A[0][i] * alpha, flops_A[1][i]), xytext=(+25, +15),
                 fontsize=11, textcoords='offset points', xycoords="data",
                 arrowprops=dict(arrowstyle='-|>')
                 )
    i = 7
    plt.annotate("{}".format(flops_A[2][i]), xy=(flops_A[0][i] * alpha, flops_A[1][i]), xytext=(+100, +50),
                 fontsize=11, textcoords='offset points', xycoords="data",
                 arrowprops=dict(arrowstyle='')
                 )
    i = 8
    plt.annotate("{}".format(flops_A[2][i]), xy=(flops_A[0][i] * alpha, flops_A[1][i]), xytext=(+45, +10),
                 fontsize=11, textcoords='offset points', xycoords="data",
                 arrowprops=dict(arrowstyle='')
                 )
    i = 9
    plt.annotate("{}".format(flops_A[2][i]), xy=(flops_A[0][i] * alpha, flops_A[1][i]), xytext=(+42, +80),
                 fontsize=11, textcoords='offset points', xycoords="data",
                 arrowprops=dict(arrowstyle='fancy')
                 )
    i = 10
    plt.annotate("{}".format(flops_A[2][i]), xy=(flops_A[0][i] * alpha, flops_A[1][i]), xytext=(+30, -43),
                 fontsize=11, textcoords='offset points', xycoords="data",
                 arrowprops=dict(arrowstyle='simple')
                 )
    i = 11
    plt.annotate("{}".format(flops_A[2][i]), xy=(flops_A[0][i] * alpha, flops_A[1][i]), xytext=(+30, -43),
                 fontsize=11, textcoords='offset points', xycoords="data",
                 arrowprops=dict(arrowstyle='wedge')
                 )
Annotate函数有众多参数,本文介绍有侧重,倾向于arrowprops中的connectionstyle。
二 Arrowprops参数中的connectionstyle
这一点才是本文的重点。
2.1 connectionstyle的效果图
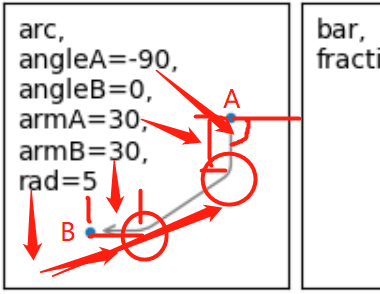
# arrowprops=dict(arrowstyle='-', connectionstyle="arc,angleA=180,angleB=0,armA=50,armB=0,rad=5")
上面的代码即是connectionstyle参数的使用位置。而它实现的效果是:
左边的图表示没有使用connectionstyle时的arrowprops;而右边的图表示有使用connectionstyle时的arrowprops。因此connectionstyle是决定了 箭头与 被指向点A或者 指向点B三者在连接处的细节处理。
; 2.2 connectionstyle的价值意义。
效果见本文的最后的案例效果图,又或者下文的图示, 可以看出,如果能够处理好与标注文本连接的横线,则绘制的图会比较美观,很好的面对点密集的场景。
2.3 connectionstyle的参数解释:
参考官网:https://matplotlib.org/stable/tutorials/text/annotations.html#sphx-glr-tutorials-text-annotations-py
2.3.1 connectionstyle的可选值。
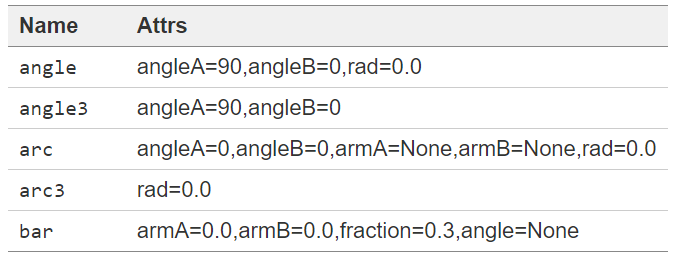
2.3.2 angleA , angleB, rad, armA, armB 五个参数的意义
- A 表示 标注文本的位置;B 表示 被标注点的位置;
- 另外五个参数通过图示的方式介绍和读者自行尝试得到。
- angle的取值是以右水平线即x轴正方向为起始方向;
- arm的取值可能跟x轴y轴的度量有关系,本人的例子中,需要指定值超过50时,才会明显的看出 手臂的存在。
- rad表示弧度的大小,微调即可。
同时结合下图的demo以更深的理解。
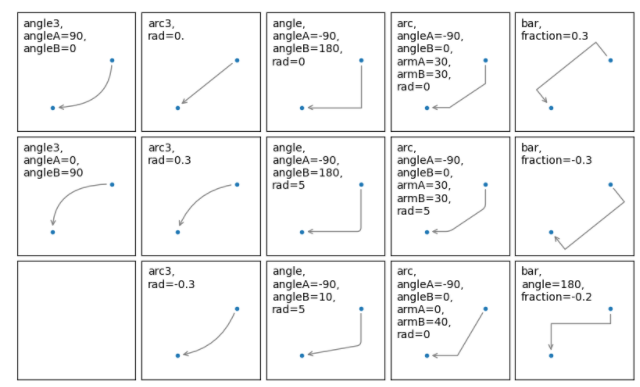
; 2.3.3 使用方式
arrowprops=dict(arrowstyle='-',
                connectionstyle="arc,angleA=180,angleB=0,armA=60,armB=0,rad=1"
                )

arrowprops=dict(arrowstyle='-',
                connectionstyle="angle3"
                )
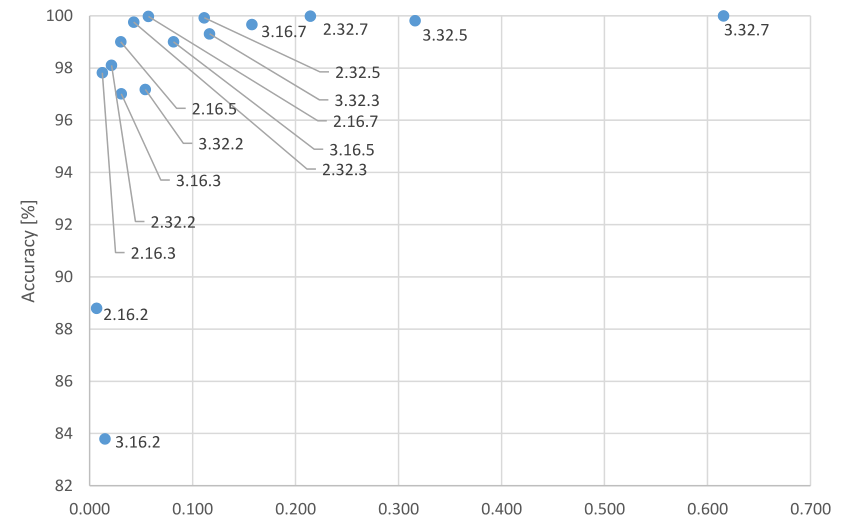
三 经典案例效果图
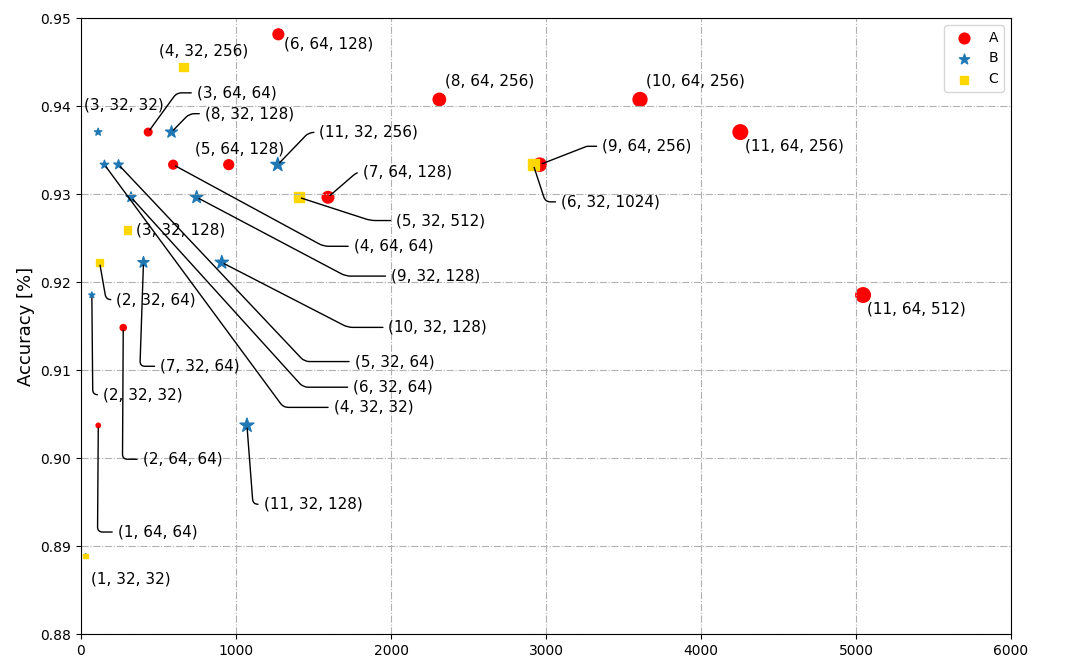
- 这是我们论文中的图示。展现的是 不同参数组合下的模型准确率与模型复杂度的tradeoff权衡图。
- 绘制该图涉及三类数据:每个模型的 参数组合(本例中为一个三元组) 、模型准确率和 模型复杂度(由FLOPs表达)。
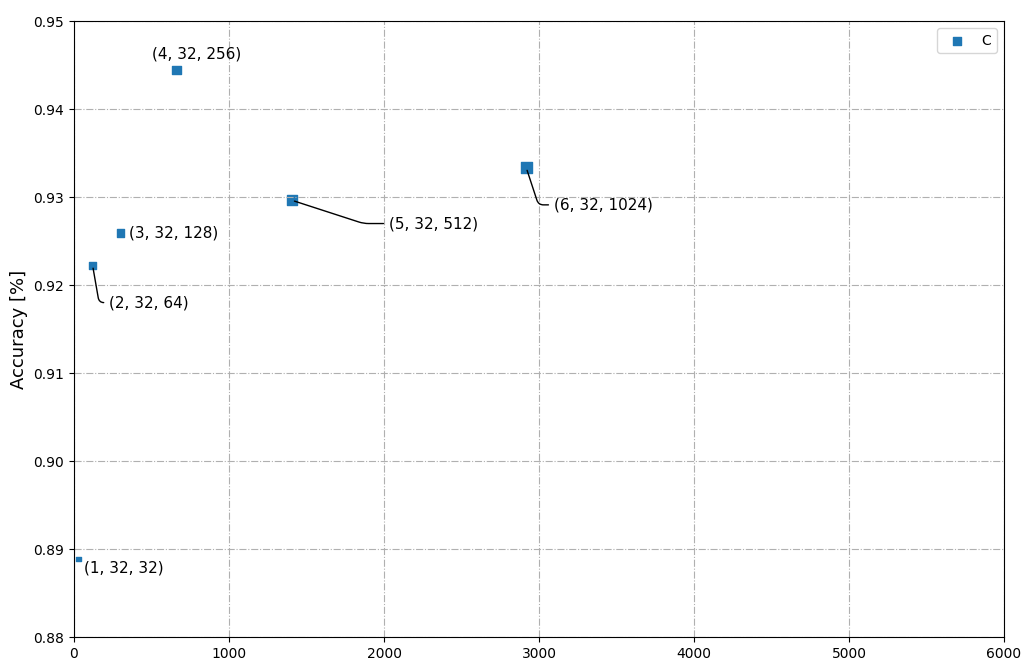
; 3.1 真实数据
flops_C = [
    [29176296192,
     14052152064,
     6617137920,
     3007642368,
     1200105216,
     292324608],
    [0.93333,
     0.92962962,
     0.944444,
     0.9259259,
     0.92222222,
     0.8888888],
    [
        (6, 32, 1024),
        (5, 32, 512),
        (4, 32, 256),
        (3, 32, 128),
        (2, 32, 64),
        (1, 32, 32),
    ]

]
3.2 代码
import os
import numpy as np
import matplotlib.pyplot as plt

def flopsC_Anotation(flops_C):

    i = 0
    plt.annotate("{}".format(flops_C[2][i]), xy=(flops_C[0][i] * alpha, flops_C[1][i]), xytext=(+20, -30),
                 fontsize=11, textcoords='offset points', xycoords="data",
                 arrowprops=dict(arrowstyle='-', connectionstyle="arc,angleA=180,angleB=0,armA=65,armB=0,rad=5"))

    i = 1
    plt.annotate("{}".format(flops_C[2][i]), xy=(flops_C[0][i] * alpha, flops_C[1][i]), xytext=(+70, -20),
                 fontsize=11, textcoords='offset points', xycoords="data",
                 arrowprops=dict(arrowstyle='-',
                                 connectionstyle="arc,angleA=180,angleB=0,armA=70,armB=0,rad=5"
                                 ))

    i = 2
    plt.annotate("{}".format(flops_C[2][i]), xy=(flops_C[0][i] * alpha, flops_C[1][i]), xytext=(-18, +8),
                 fontsize=11, textcoords='offset points', xycoords="data",
                 )

    i = 3
    plt.annotate("{}".format(flops_C[2][i]), xy=(flops_C[0][i] * alpha, flops_C[1][i]), xytext=(+6, -3),
                 fontsize=11, textcoords='offset points', xycoords="data",

                 )

    i = 4
    plt.annotate("{}".format(flops_C[2][i]), xy=(flops_C[0][i] * alpha, flops_C[1][i]), xytext=(+12, -30),
                 fontsize=11, textcoords='offset points', xycoords="data",
                 arrowprops=dict(arrowstyle='-', connectionstyle="arc,angleA=180,angleB=0,armA=50,armB=0,rad=5"))

    i = 5
    plt.annotate("{}".format(flops_C[2][i]), xy=(flops_C[0][i] * alpha, flops_C[1][i]), xytext=(+4, -10),
                 fontsize=11, textcoords='offset points', xycoords="data",

                 )

if __name__ == '__main__':
    flops_C = [
        [29176296192,
         14052152064,
         6617137920,
         3007642368,
         1200105216,
         292324608],
        [0.93333,
         0.92962962,
         0.944444,
         0.9259259,
         0.92222222,
         0.8888888],
        [
            (6, 32, 1024),
            (5, 32, 512),
            (4, 32, 256),
            (3, 32, 128),
            (2, 32, 64),
            (1, 32, 32),
        ]

    ]

    flops_C = np.array(flops_C)

    alpha = 0.0000001

    plt.figure(figsize=(12, 8))
    plt.scatter(flops_C[0] * alpha, flops_C[1], c="#1f77b4", s=np.array([list(x) for x in flops_C[2]])[:, 0] * 10,
                marker="s", label="C")

    flopsC_Anotation(flops_C)

    plt.ylabel("Accuracy [%]", fontsize=13)

    plt.xlim(0, 6000)
    plt.ylim(0.88, 0.95)

    plt.legend()
    plt.grid(linestyle="-.")
    plt.show()
Original: https://blog.csdn.net/m0_38052500/article/details/117518301
Author: MarToony|名角
Title: Matplotlib箭头风格与标注文本连接|plt.annotate函数与connectionstyle参数的使用与案例代码
原创文章受到原创版权保护。转载请注明出处:https://www.johngo689.com/600057/
转载文章受原作者版权保护。转载请注明原作者出处!