

完整的kubernetes部署文件
1234567891011121314151617181920212223242526272829303132333435363738394041424344454647484950515253545556575859606162636465666768697071
blackbox-exporter-deploy.yaml apiVersion: extensions/v1beta1kind: Deploymentmetadata: name: prometheus-blackbox-exporter namespace: monitoringspec: selector: matchLabels: app: prometheus-blackbox-exporter replicas: 1 template: metadata: labels: app: prometheus-blackbox-exporter spec: restartPolicy: Always containers: - name: prometheus-blackbox-exporter image: prom/blackbox-exporter:v0.12.0 imagePullPolicy: IfNotPresent ports: - name: blackbox-port containerPort: 9115 readinessProbe: tcpSocket: port: 9115 initialDelaySeconds: 5 timeoutSeconds: 5 resources: requests: memory: 50Mi cpu: 100m limits: memory: 60Mi cpu: 200m volumeMounts: - name: config mountPath: /etc/blackbox_exporter args: - --config.file=/etc/blackbox_exporter/blackbox.yml - --log.level=debug - --web.listen-address=:9115 volumes: - name: config configMap: name: prometheus-blackbox-exporter tolerations: - key: "node-role.kubernetes.io/master" effect: "NoSchedule"---apiVersion: v1kind: Servicemetadata: labels: app: prometheus-blackbox-exporter name: blackbox-exporter namespace: monitoring annotations: prometheus.io/scrape: 'true'spec: type: NodePort selector: app: prometheus-blackbox-exporter ports: - name: blackbox port: 9115 targetPort: 9115 protocol: TCP
bash;gutter:false;
cat blackbox-exporter-configmap.yaml
apiVersion: v1
kind: ConfigMap
metadata:
  name: prometheus-blackbox-exporter
  namespace: monitoring
data:
  blackbox.yml: |-
    modules:
      http_2xx:  # http 检测模块  Blockbox-Exporter 中所有的探针均是以 Module 的信息进行配置
        prober: http
        timeout: 10s
        http:
          valid_http_versions: ["HTTP/1.1", "HTTP/2"]
          valid_status_codes: [200,201, 202, 300, 301, 302, 303, 400, 401, 402, 403, 404]  # 这里最好作一个返回状态码,在grafana作图时,有明示---陈刚注释。
          method: GET
          preferred_ip_protocol: "ip4"
      http_post_2xx: # http post 监测模块
        prober: http
        timeout: 10s
        http:
          valid_http_versions: ["HTTP/1.1", "HTTP/2"]
          method: POST
          preferred_ip_protocol: "ip4"
      tcp_connect:  # TCP 检测模块
        prober: tcp
        timeout: 10s
      dns:  # DNS 检测模块
        prober: dns
        dns:
          transport_protocol: "tcp"  # 默认是 udp
          preferred_ip_protocol: "ip4"  # 默认是 ip6
          query_name: "kubernetes.default.svc.cluster.local"</p>
<pre><code>
prometheus的配置文件

</code></pre>
<p>12345678910111213141516</p>
<pre><code>
</code></pre>
<ul>
<li>job_name: 'blackbox'   metrics_path: /probe   params:     module: [http_2xx]  # Look for a HTTP 200 response.   static_configs:     - targets:       - http://prometheus.io    # Target to probe with http.       - https://prometheus.io   # Target to probe with https.       - http://example.com:8080 # Target to probe with http on port 8080.   relabel_configs:     - source_labels: [<strong>address</strong>]       target_label: <strong>param_target     - source_labels: [__param_target]       target_label: instance     - target_label: __address</strong>       replacement: blackbox-exporter:9115  # The blackbox exporter's real hostname:port</li>
</ul>
<pre><code>
;gutter:false;
– job_name: ‘port_status’
metrics_path: /probe
params:
module: [tcp_connect]
static_configs:
– targets: [‘103.****:12000’]
– targets: [‘103.****:13000’]
– targets: [‘211.***:12001’]
– targets: [‘211.****:13800’]
labels:
instance: ‘port_status’
group: ‘tcp’
relabel_configs:
– source_labels: [__address__]
target_label: __param_target
– source_labels: [__param_target]
target_label: instance
– target_label: __address__
replacement: 17****:30139

prometheus的配置文件alermanager报警规则
bash;gutter:false;
cat blackexporter_prometheusRule.yaml
apiVersion: monitoring.coreos.com/v1
kind: PrometheusRule
metadata:
labels:
prometheus: k8s
role: alert-rules
name: web-status-prometheus-rules
namespace: monitoring
spec:
groups:
- name: web-status
rules:
- alert: BlackboxProbeHttpFailure
expr: probe_http_status_code = 500
for: 5m
labels:
severity: error
annotations:
summary: "Blackbox probe HTTP failure (instance {{ $labels.instance }})"
message: "HTTP status code is not 200-499\n VALUE = {{ $value }}"
- alert: 网站异常
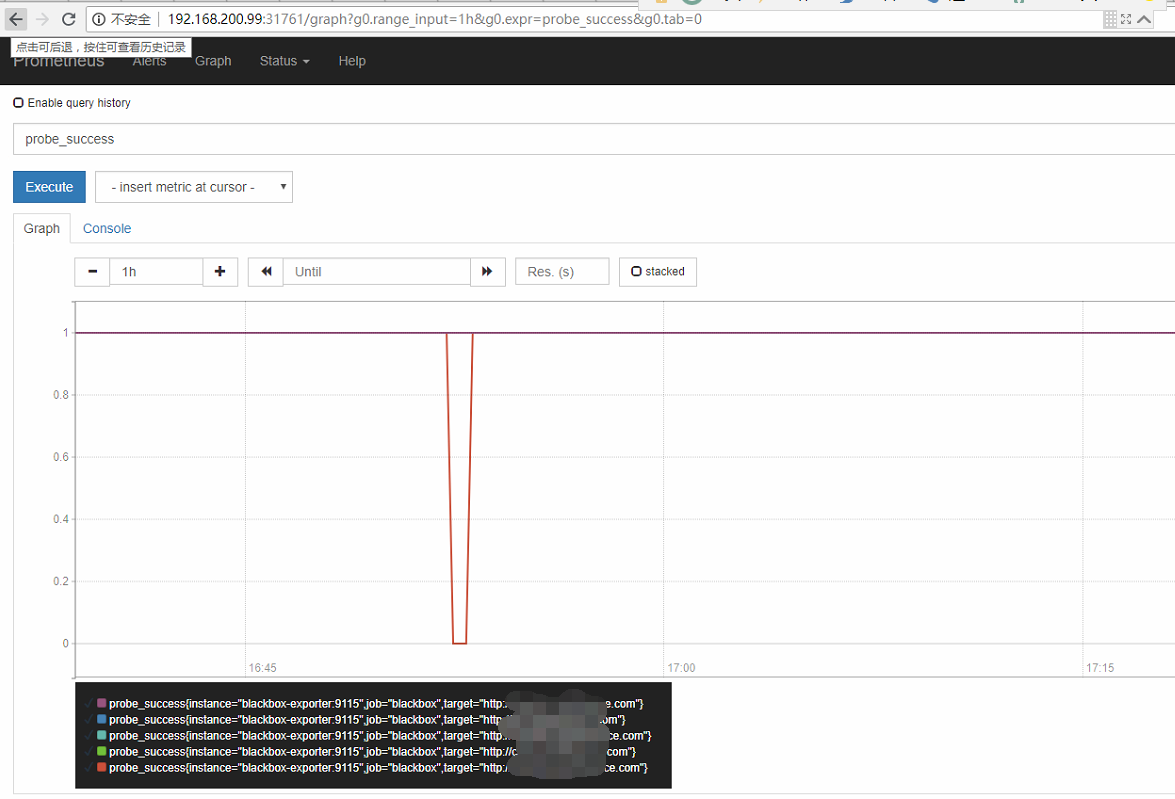
expr: up{job="blackbox"} == 0 or probe_success{job="blackbox"} == 0
for: 10s
labels:
severity: critica
annotations:
summary: "网站 {{ $labels.instance }} 访问异常"</p>
<pre><code>
;gutter:false;
– name: tcp-status
rules:
– alert: tcp端口异常
expr: up{job="port_status"} == 0 or probe_success{job="port_status"} == 0
for: 1m
labels:
severity: critical
annotations:
summary: "端口 {{ $labels.instance }} 访问异常"
ssl检测
groups:
- name: check_ssl_status
  rules:
  - alert: "ssl证书过期警告"
    expr: (probe_ssl_earliest_cert_expiry - time())/86400

Original: https://www.cnblogs.com/weifeng1463/p/16145594.html
Author: Oops!#
Title: 使用Prometheus的blackbox_exporter进行网络监控
原创文章受到原创版权保护。转载请注明出处:https://www.johngo689.com/553860/
转载文章受原作者版权保护。转载请注明原作者出处!