

转自:https://www.cnblogs.com/linhaostudy/p/16182795.html
正文
在对ssd性能调优过程中,有使用到blktrace,本文对blktrace做一个记录
回到顶部
文章目录
- blktrace介绍
- blktrace aarch64移植
- 使用
- 实例
- 数据分析
- blktrace分析ssd性能差的问题实例
1. blktrace介绍
我们首先需要知道提交到 block I/O层的每个I/O执行的具体操作,如下图所示


blktrace功能如下:
- 提供关于单个I/O的详细的block layer信息
- 低开销内核跟踪机制(在I/O压力相对较大的情况下,对应用程序性能的影响不到2%)
- 可配置:
- 可以指定一个或多个物理设备或逻辑设备
- 用户可选择事件-可以在事件获取和/或格式化输出时指定过滤器
- 同时支持”实时”和”回放”跟踪
blktrace总体架构如下:

回到顶部
2. blktrace aarch64移植
首先对blktrace,blkparse ,btt做个简单的介绍,blktrace负责采集,blkparse负责对采集的数据进行解析,而btt能够协助分析统计
blktrace选项如下,常用的使用有
- -d dev #添加一个设备追踪
- -o file #指定输出文件的名字
root@a1000:~# blktrace
blkparse选项如下,常用的使用有
- -i input #输入包含跟踪数据的文件
- -o output #输出文件。如果未给出,则输出为标准输出
root@a1000:~# blkparse -h
Usage: blkparse

-i <file>           |
折叠
btt选项如下,常用的使用有
- -i input #输入文件
root@a1000:~# btt -h
Usage: btt
[ -a               | --seek-absolute ]
[ -A               | --all-data ]
[ -B <output name> | --dump-blocknos=<output name> ]
[ -d <seconds>     | --range-delta=<seconds> ]
[ -D      | --devices= ]
[ -e      | --exes=  ]
[ -h               | --help ]
[ -i <input name>  | --input-file=<input name> ]
[ -I <output name> | --iostat=<output name> ]
[ -l <output name> | --d2c-latencies=<output name> ]
[ -L <freq>        | --periodic-latencies=<freq> ]
[ -m <output name> | --seeks-per-second=<output name> ]
[ -M <dev map>     | --dev-maps=<dev map>
[ -o <output name> | --output-file=<output name> ]
[ -p <output name> | --per-io-dump=<output name> ]
[ -P <output name> | --per-io-trees=<output name> ]
[ -q <output name> | --q2c-latencies=<output name> ]
[ -Q <output name> | --active-queue-depth=<output name> ]
[ -r               | --no-remaps ]
[ -s <output name> | --seeks=<output name> ]
[ -S <interval>    | --iostat-interval=<interval> ]
[ -t <sec>         | --time-start=<sec> ]
[ -T <sec>         | --time-end=<sec> ]
[ -u <output name> | --unplug-hist=<output name> ]
[ -V               | --version ]
[ -v               | --verbose ]
[ -X               | --easy-parse-avgs ]
[ -z <output name> | --q2d-latencies=<output name> ]
[ -Z               | --do-active
4. 实例
- 对/dev/nvme0n1p1进行采集,随后执行dd命令。
root@a1000:~
- 利用blkparse对blktrace采集的文件进行解析,其中-d 是输出二进制文件,方便btt分析,-o 是将blkparse解析的数据放入nvme_data中,可自行分析。
root@a1000:~
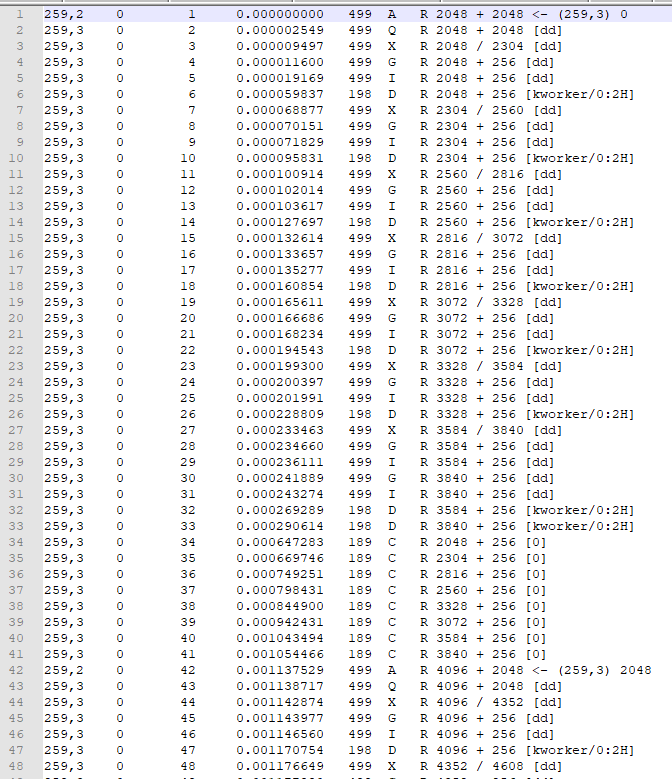
nvme_data原始数据内容如下:
- btt解析nvme.blktrace.bin
root@a1000:~# btt -i nvme.blktrace.bin
==================== All Devices ====================

            ALL           MIN           AVG           MAX           N
折叠
回到顶部
5. 数据分析
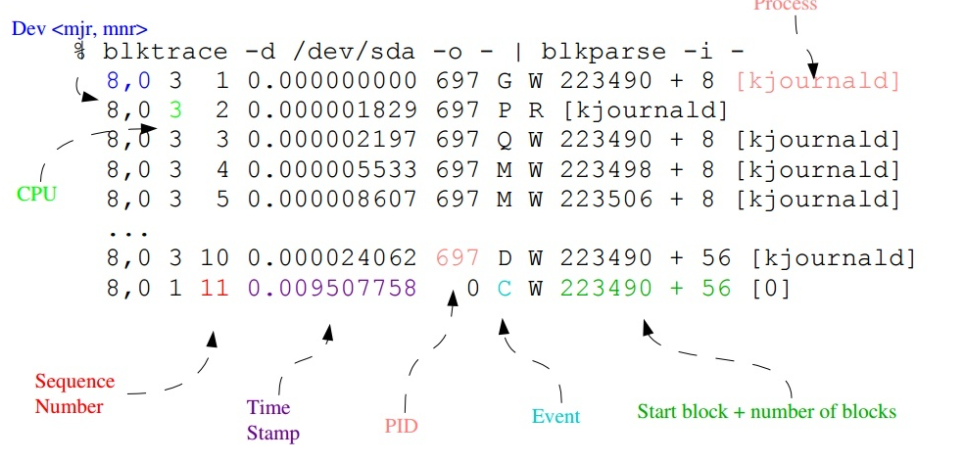
第7个字段在上图中没有标出来,它表示操作类型,具体含义是:
“R” for Read, “W” for Write, “D” for block, “B” for Barrier operation。
第6个字段Event解释如下:

 Q------->G------------>I--------->M------------------->D----------------------------->C
 |-Q time-|-Insert time-|
 |--------- merge time ------------|-merge with other IO|
 |----------------scheduler time time-------------------|---driver,adapter,storagetime--|

 |----------------------- await time in iostat output ----------------------------------|
其中:
Q2Q — time between requests sent to the block layer
Q2G — time from a block I/O is queued to the time it gets a request allocated for it
G2I — time from a request is allocated to the time it is Inserted into the device’s queue
Q2M — time from a block I/O is queued to the time it gets merged with an existing request
I2D — time from a request is inserted into the device’s queue to the time it is actually issued to the device
M2D — time from a block I/O is merged with an exiting request until the request is issued to the device
D2C — service time of the request by the device
Q2C — total time spent in the block layer for a request
blkparse解析出来的数据依旧是很难直接进行分析的,btt是对这些数据做一个总结。
回到顶部
6. blktrace分析ssd性能差的问题实例
如果您觉得阅读本文对您有帮助,请点一下"推荐"按钮,您的"推荐"将是我最大的写作动力!
Original: https://www.cnblogs.com/sky-heaven/p/16423322.html
Author: sky-heaven
Title: blktrace 编译与使用【转】
原创文章受到原创版权保护。转载请注明出处:https://www.johngo689.com/545650/
转载文章受原作者版权保护。转载请注明原作者出处!