

Lab1
历时2天,完成了LAB1,完整代码仓库可点击:https://github.com/Elio-yang/MIT6.828
partA 练习
- *exercise3
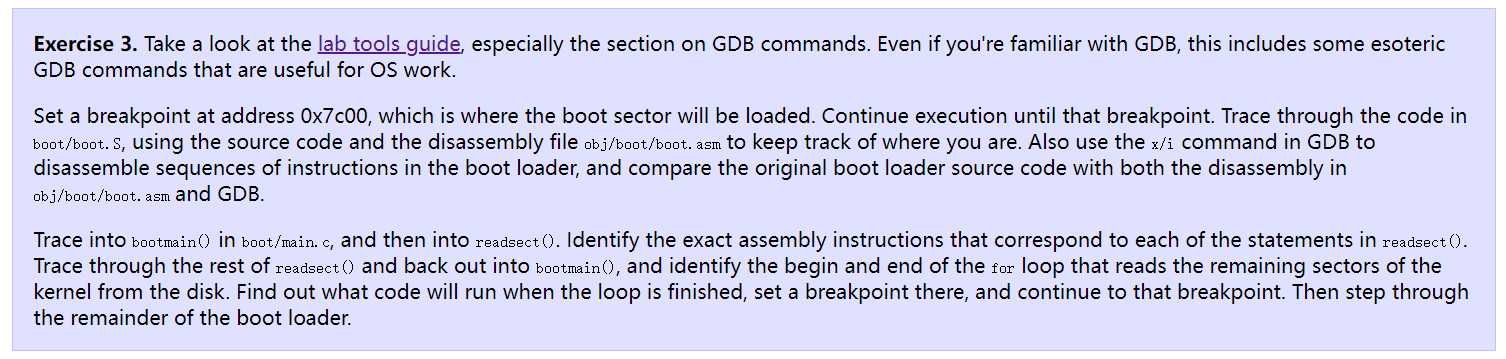

gdb指令:
x/Ni addr :反汇编addr处的N条指令
x/Nx addr:打印N字节addr处的内存
b *addr:在addr处设置断点
readsect(): 0x7c7c
bootmain():0x7d25
循环结束的第一条指令是0x7d81处的 call *0x10018,利用 gdb, 0x10018内存处的值为 0x10000c,故第一条指令是 call 0x10000c。这个地址就是kernel的entry。
At what point does the processor start executing 32-bit code? What exactly causes the switch from 16- to 32-bit mode?
从 ljmp $PROT_MODE_CSEG,$protcseg这条指令后开始执行32位代码。真正造成切换的,是 CR0的 PE位被置为,进入了保护模式。
What is the last instruction of the boot loader executed, and what is the first instruction of the kernel it just loaded?
last:
call *0x10018
first:
f010000c :
f010000c:   66 c7 05 72 04 00 00    movw   $0x1234,0x472
Where is the first instruction of the kernel?
很显然在0x10000c。
How does the boot loader decide how many sectors it must read in order to fetch the entire kernel from disk? Where does it find this information?
都是通过ELF header得知的。
Loading the kernel
首先要注意的是代码的链接地址和加载地址
[En]
The first thing to pay attention to is the link address and load address of the code
使用命令
objdump -h
-x Display all available header information
-f Display entry point
更多用法 man objdump 即可
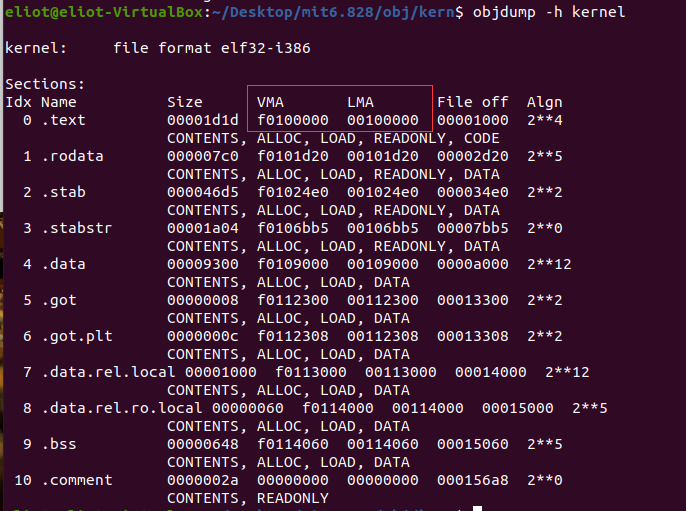
在kernel中这两者是不同的,但是在之前的boot中
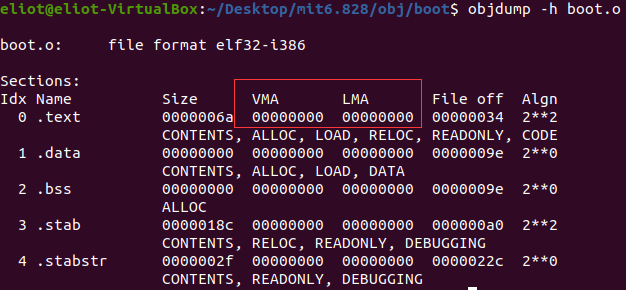
二者是一致的。在 kern/entry.S中有这样一段代码
Turn on paging.

movl    %cr0, %eax
orl $(CR0_PE|CR0_PG|CR0_WP), %eax
movl    %eax, %cr0
这便开启了地址映射,在此之前kernel的VMA和LMA地址处的内存一般是不同的,但是开启分页之后,LMA映射到了VMA。
The Kernel
第一个值得注意的是:开启分页模式,将虚拟地址[0, 4MB)映射到物理地址[0, 4MB),[0xF0000000, 0xF0000000+4MB)映射到[0, 4MB)(/kern/entry.S)
分页模式下的寻址,在Intel手册中也有给出

开启这个模式的代码如下
Load the physical address of entry_pgdir into cr3.  entry_pgdir
is defined in entrypgdir.c.

movl    $(RELOC(entry_pgdir)), %eax
movl    %eax, %cr3
Turn on paging.

movl    %cr0, %eax
orl $(CR0_PE|CR0_PG|CR0_WP), %eax
movl    %eax, %cr0
关于地址的映射在 kern/entrypgdir.c有代码实现
__attribute__((__aligned__(PGSIZE)))
pde_t entry_pgdir[NPDENTRIES] = {
    // Map VA's [0, 4MB) to PA's [0, 4MB)
    [0]
        = ((uintptr_t)entry_pgtable - KERNBASE) + PTE_P,
    // Map VA's [KERNBASE, KERNBASE+4MB) to PA's [0, 4MB)
    [KERNBASE>>PDXSHIFT]
        = ((uintptr_t)entry_pgtable - KERNBASE) + PTE_P + PTE_W
};
编译器分配的空间是强制性4kB页对齐的。 pgdir是一个1024项的数组。这里可以不用详细了解原理 For now, you don't have to understand the details of how this works, just the effect that it accomplishes.
- *exercise7
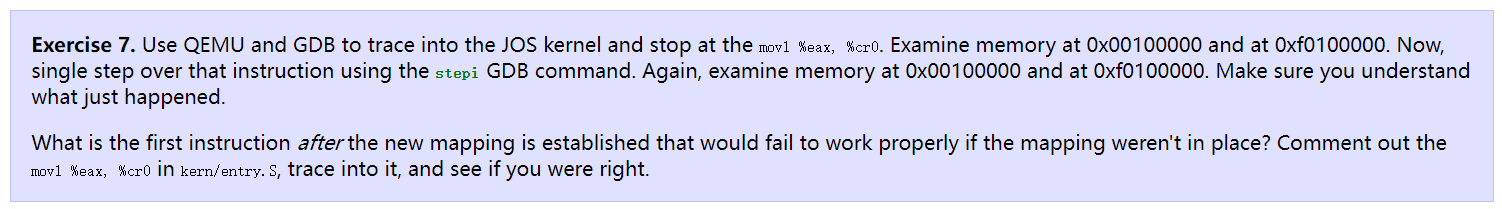
在开启寻呼之前,两个地址的内容不一致,其次是地址映射,两者的内容是相同的。注释掉
[En]
Before opening paging, the contents of the two addresses are inconsistent, followed by address mapping, and the contents of the two are the same. Comment out
movl %eax, %cr0程序会崩溃。
Formated Printing to the Console
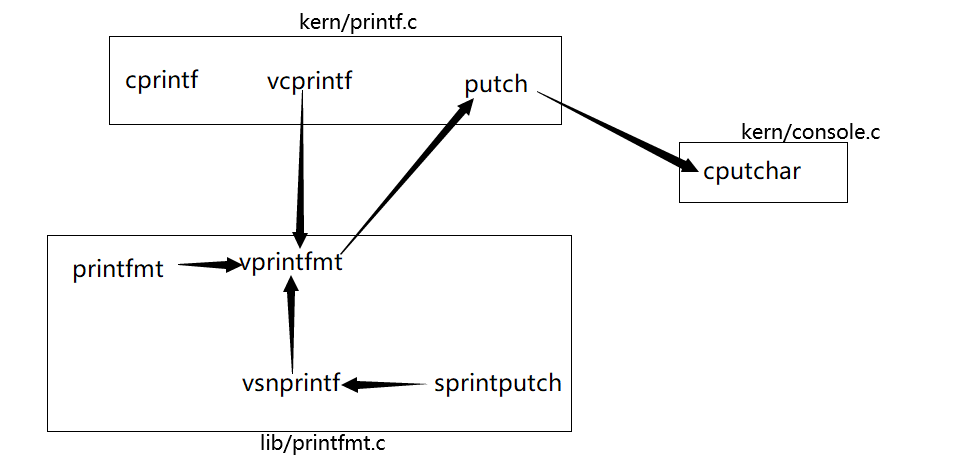
第一个是几个函数的调用关系。
[En]
The first is the calling relationship of several functions.
然后练习题
- *exercise8

这个文件就是 lib/printfmt.c
// (unsigned) octal
case 'o':
    // Replace this with your code.

    num=getuint(&ap,lflag);
    base=8;
    goto number;
对照上下文很容易补全。
下面是回答问题:
Explain the interface between
printf.candconsole.c. Specifically, what function doesconsole.cexport? How is this function used byprintf.c?
对照上文调用关系图即可
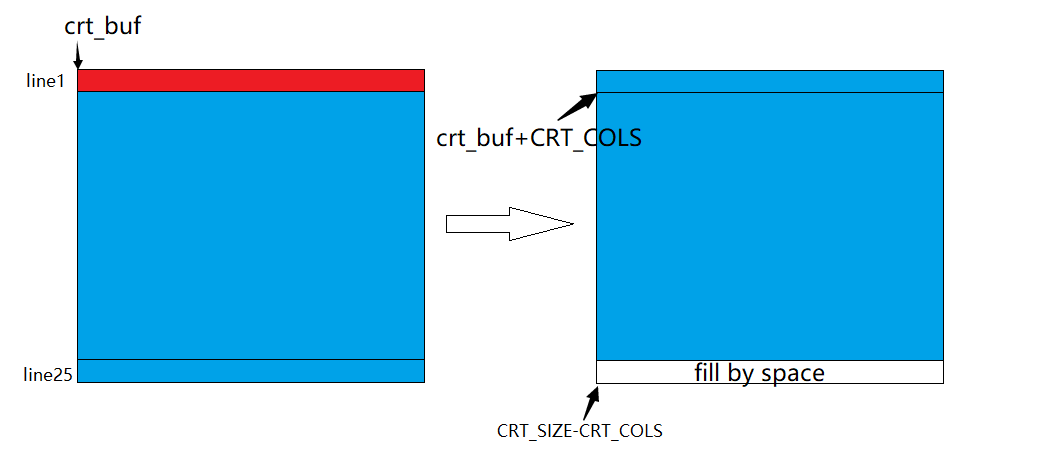
Explain the following from console.c
if (crt_pos >= CRT_SIZE) {
    int i;
    memmove(crt_buf, crt_buf + CRT_COLS, (CRT_SIZE - CRT_COLS) *sizeof(uint16_t));
    for (i = CRT_SIZE - CRT_COLS; i < CRT_SIZE; i++)
        crt_buf[i] = 0x0700 | ' ';
    crt_pos -= CRT_COLS;
}
首先文本模式最多能显示 25*80个字符,即25行每行80个。此处
// console.h
#define CRT_ROWS    25
#define CRT_COLS    80
#define CRT_SIZE    (CRT_ROWS * CRT_COLS)
因此,这一段涉及屏幕之外的实践:丢弃最上面的一行,整体上移一行。
[En]
Therefore, this paragraph deals with the practice beyond a screen: discard the top line and move up one line as a whole.
For the following questions you might wish to consult the notes for Lecture 2. These notes cover GCC’s calling convention on the x86.
Trace the execution of the following code step-by-step:
int x = 1, y = 3, z = 4;
cprintf("x %d, y %x, z %d\n", x, y, z);
-
In the call to
cprintf(), to what doesfmtpoint? To what doesappoint? -
List (in order of execution) each call to
cons_putc,va_arg, andvcprintf. Forcons_putc, list its argument as well. Forva_arg, list whatappoints to before and after the call. Forvcprintflist the values of its two arguments.
GCC 函数调用约定是参数从右往左入栈。此处 fmt指向的就是第一个参数的位置。而 ap指向第一个可变参数,也就是第二个参数 x的位置。关于变参数,JOS使用的是GCC builtin来实现的。其实现可以用如下代码进行大致说明(不是严谨的完整实现):
#define va_start(list,param_1st)   ( list = (va_list)¶m1+ sizeof(param_1st) )
#define va_arg(list,type)   ( (type *) ( list += sizeof(type) ) )[-1]
#define va_end(list) ( list = (va_list)0 )
因此:
va_list:即 char*
va_start:获取第一个可变参数的地址
va_arg:返回指向下一个参数的指针
va_end:清空参数列表
Run the following code.
    unsigned int i = 0x00646c72;
    cprintf("H%x Wo%s", 57616, &i);
What is the output? Explain how this output is arrived at in the step-by-step manner of the previous exercise.
Here’s an ASCII tablethat maps bytes to characters.
The output depends on that fact that the x86 is little-endian. If the x86 were instead big-endian what would you set i to in order to yield the same output? Would you need to change 57616 to a different value?
Here’s a description of little- and big-endian and a more whimsical description.
把这段代码加入 init.c中,运行 make qemu,结果如下
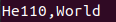
0xe110=57616这很好解释,查阅ASCII表,得知
00(\0) 64(d) 6c(l) 72(r)
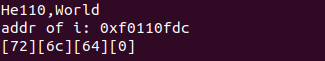
显然这是由于小端模式而使用的一个数。为了证明这一点,可以输出 &i内存处的字节。将下面这段代码放在上面打印代码的后面
cprintf("addr of i: %p\n",&i);
char *p=(char*)&i;
for(int i=0;i
输出结果如下:
In the following code, what is going to be printed after
'y='? (note: the answer is not a specific value.) Why does this happen?
cprintf("x=%d y=%d", 3);
运行结果如下
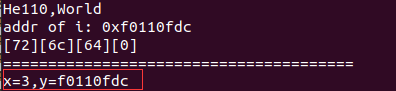
显然y的值并不一定固定,他就是把内存中那个位置的数拿来充当了第二个参数。
Let’s say that GCC changed its calling convention so that it pushed arguments on the stack in declaration order, so that the last argument is pushed last. How would you have to change
cprintfor its interface so that it would still be possible to pass it a variable number of arguments?
更改了入栈方式,相应地更改 va_start和 va_start即可。
The Stack
先看这个练习
- *exercise9

在 entry.S中可以找到如下代码
where the stack is set.

Clear the frame pointer register (EBP)
so that once we get into debugging C code,
stack backtraces will be terminated properly.

movl    $0x0,%ebp           # nuke frame pointer
Set the stack pointer
movl    $(bootstacktop),%esp
now to C code
call    i386_init
利用 gdb得知, movl $(bootstacktop),%esp会被编译为 movl $0xf0110000,%esp。因此栈何时初始化,栈放在哪儿都清楚了。继续看代码
###################################################################
boot stack
###################################################################
    .p2align    PGSHIFT     # force page alignment
    .globl      bootstack
bootstack:
    .space      KSTKSIZE
    .globl      bootstacktop
这便开辟了栈的大小,即 32KB。栈由高地址向低地址增长。
下面,关于函数的调用过程,做一个总结,可以参考[CSAPP,p164]。
这是从课件ppt截取的两页
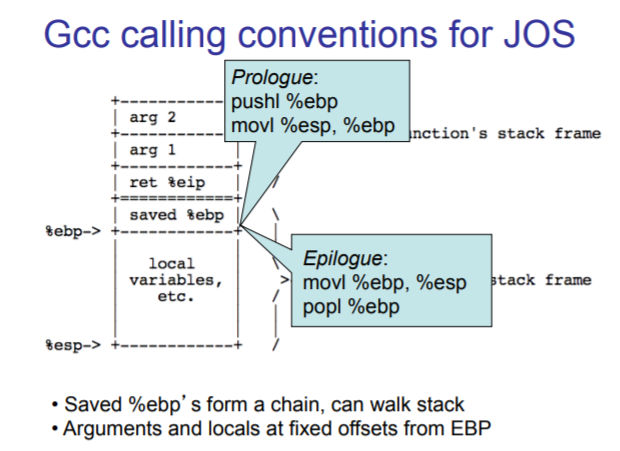
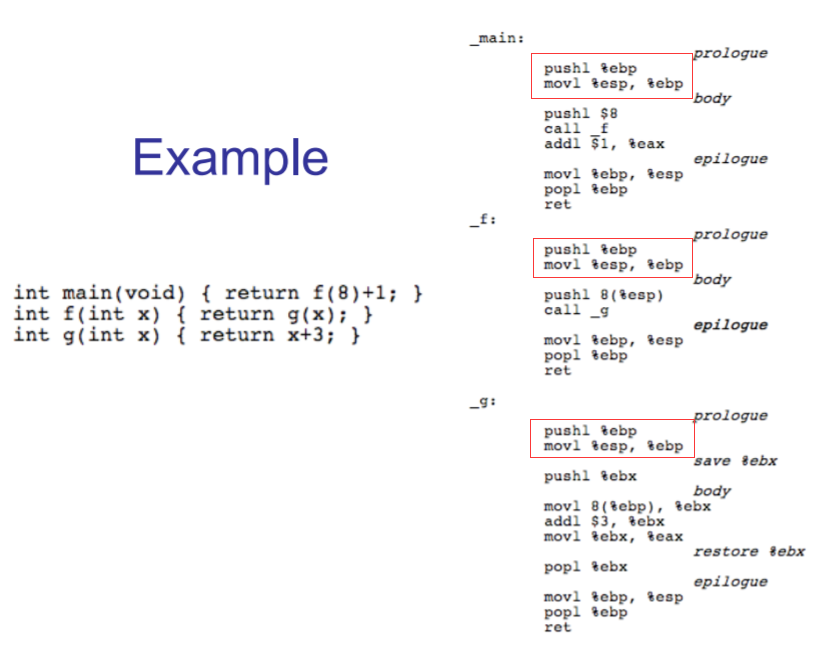
对于函数的调用,通常会发生以下操作:
[En]
With regard to the call of a function, the following actions generally occur:
- 函数调用者(caller)将参数入栈,按照 从右到左的顺序入栈
- call指令会 自动将当前 %eip(指向call的后面一条指令)入栈,ret指令将 自动从栈中弹出该值到eip寄存器
- 被调用函数(callee)负责:将%ebp入栈,%esp的值赋给%ebp。
因此,该函数将从两条类似的指令开始。
[En]
So the function will start with two similar instructions.
push %ebp
mov %esp,%ebp
因此整个 调用链差不多可以描述成如下形式
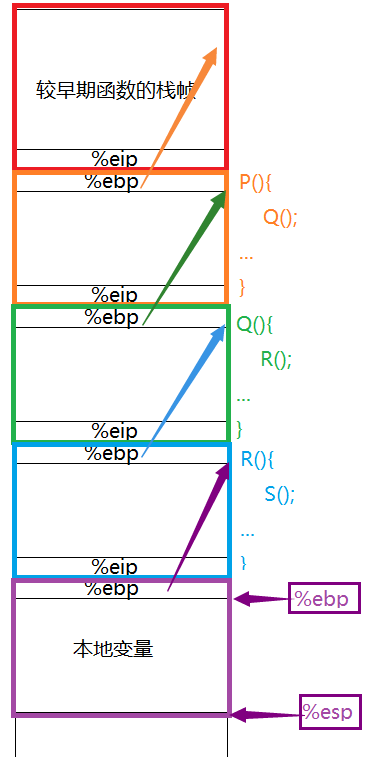
来到下一个练习
- *exercise10
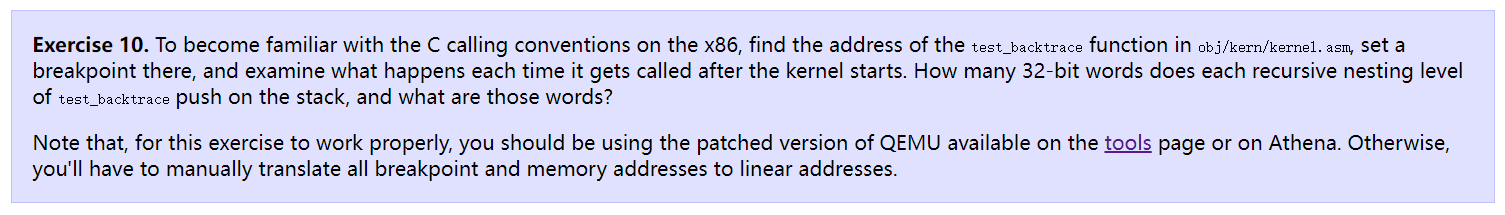
每次call之后会干什么,上文已经分析了。至于每次递归入栈的字,伪代码可以表示为
push %eip
push %ebp
push %esi
push %ebx
共计 0x10B。
- *exercise11
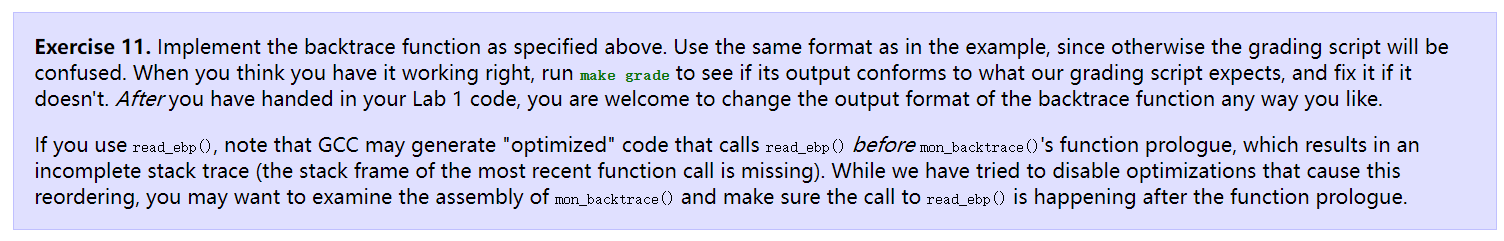
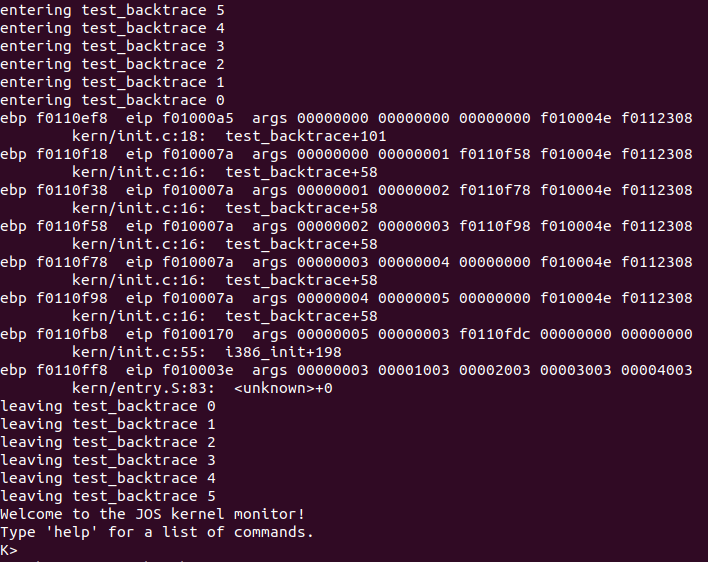
需要我们更改 mom_backtrace()函数,达到的效果如下:
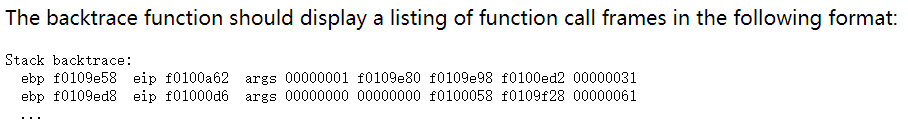
题目中已经说明,获得 %ebp的函数就是 read_ebp()。那么编码工作应该很好完成了(利用调用链中 %ebp的链)
int
mon_backtrace(int argc, char **argv, struct Trapframe *tf)
{
    // Your code here.
    uint32_t *ebp=(uint32_t*)read_ebp();
    while(ebp!=NULL){
        cprintf("ebp %8x  eip %8x  args %08x %08x %08x %08x %08x\n",
            ebp,ebp[1],ebp[2],ebp[3],ebp[4],ebp[5],ebp[6]);
        ebp=(uint32_t *)(*ebp);
    }
    return 0;
}
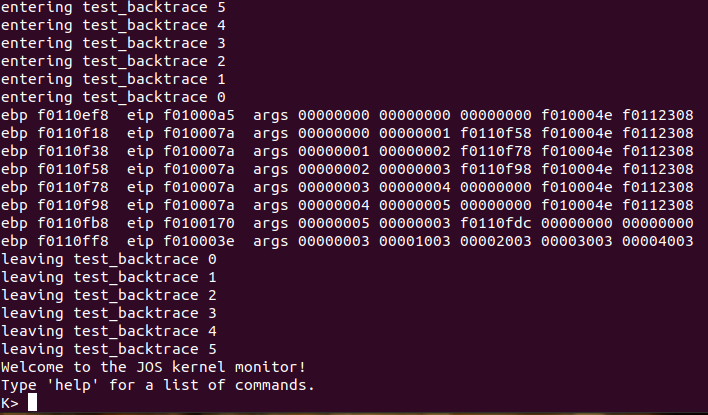
运行结果如下
- *exercise12
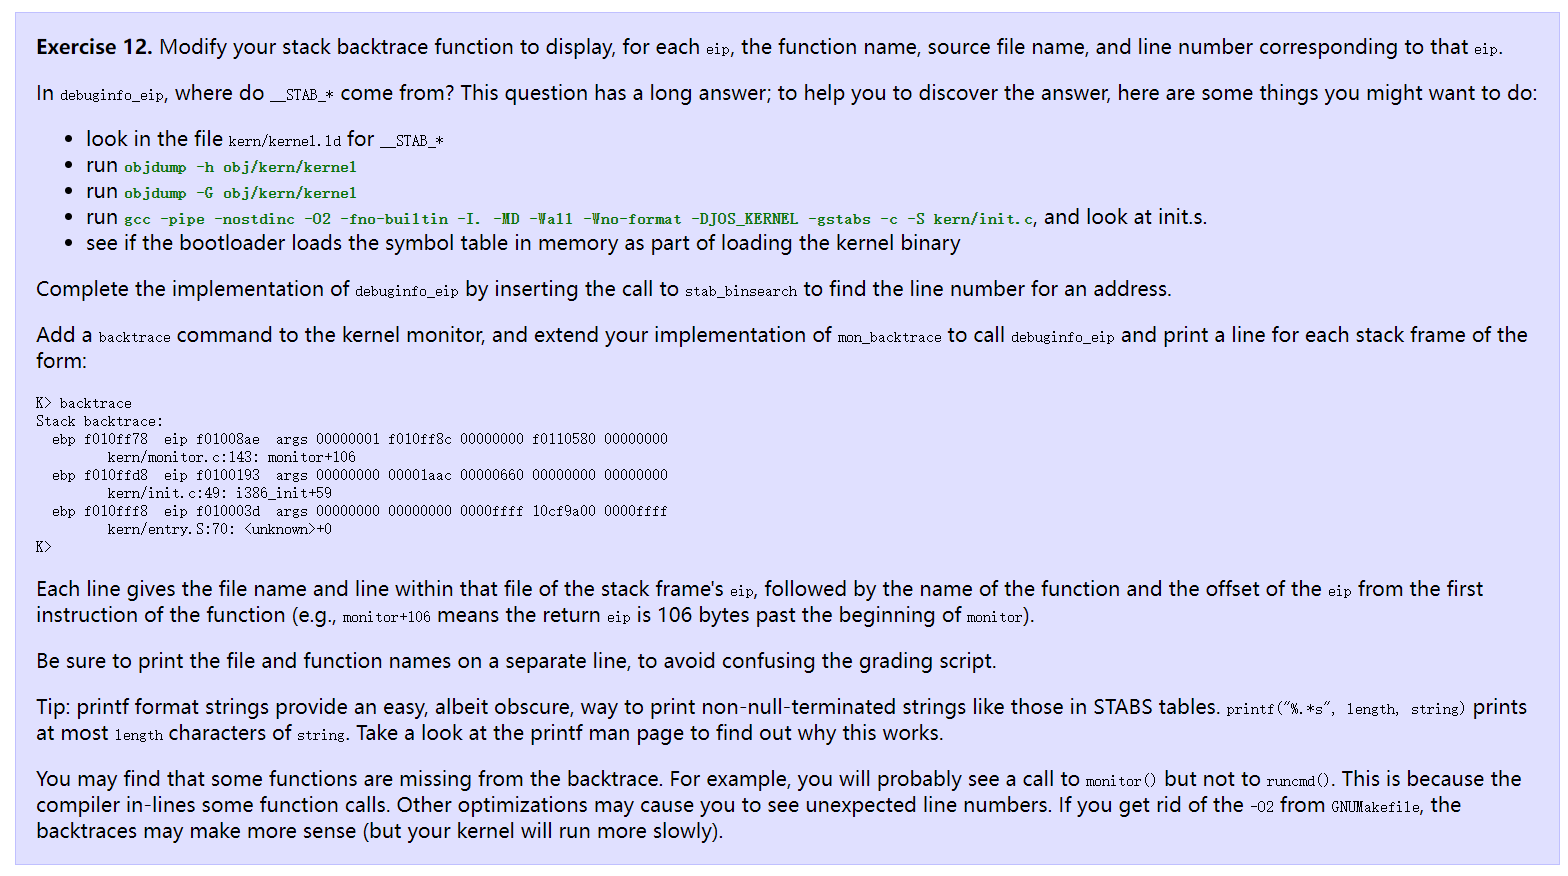
练习12的任务有三个:
- 搞清楚
__STAB_* - 添加命令
backtrace -
完善
mon_backtrace -
任务一 根据提示,查看这几个文件,首先是
kernel.ld。
.stab : {
                PROVIDE(__STAB_BEGIN__ = .);
                *(.stab);
                PROVIDE(__STAB_END__ = .);
                BYTE(0)         /* Force the linker to allocate space
                                   for this section */
        }

.stabstr : {
                PROVIDE(__STABSTR_BEGIN__ = .);
                *(.stabstr);
                PROVIDE(__STABSTR_END__ = .);
                BYTE(0)         /* Force the linker to allocate space
                                   for this section */
        }
可以知道 .stab和 .stabstr应该是两个段。 接着 objdump -h obj/kern/kernel
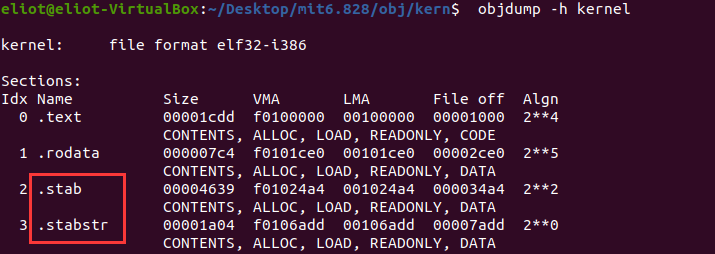
然后是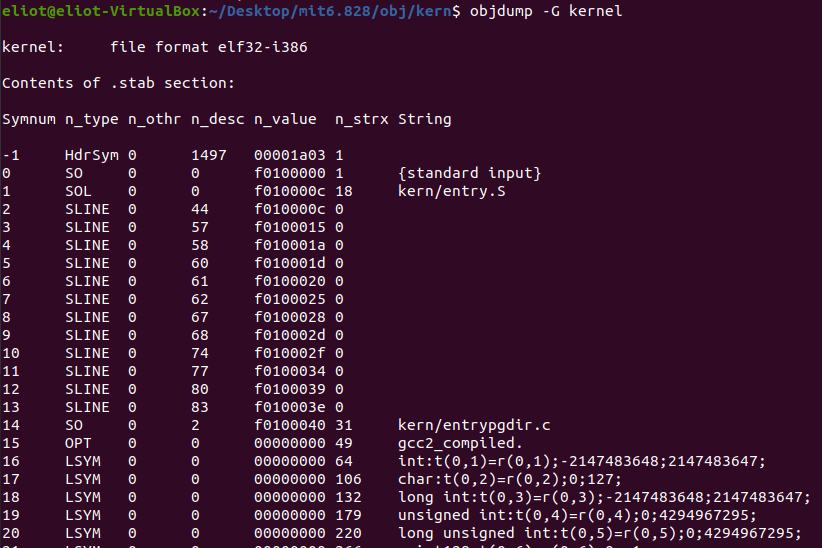
执行后面的操作以后,大致可以知道这是一个段,包含了调试信息(符号表)。细节可以不用太了解。接着找到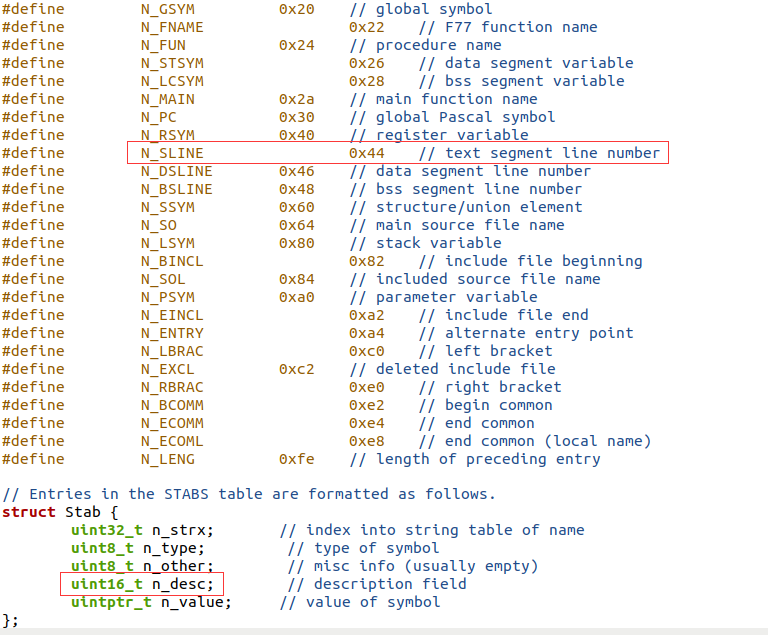
这两项便是后文编码寻找行号时需要的。下面开始任务二和三
- 任务二 题目中提示了需要使用
debuginfo_eip,查找这个函数发现,他会将需要的信息存到类型为struct Eipdebuginfo的结构体中。查看该结构体定义(kern/kdebebug.h)
// Debug information about a particular instruction pointer
struct Eipdebuginfo {
    const char *eip_file;       // Source code filename for EIP
    int eip_line;               // Source code linenumber for EIP

    const char *eip_fn_name;    // Name of function containing EIP
                                //  - Note: not null terminated!

    int eip_fn_namelen;     // Length of function name
    uintptr_t eip_fn_addr;      // Address of start of function
    int eip_fn_narg;        // Number of function arguments
};
因此只需要使用 debuginfo_eip填充该结构体,再输出信息即可。
static struct Command commands[] = {
    { "help", "Display this list of commands", mon_help },
    { "kerninfo", "Display information about the kernel", mon_kerninfo },
    { "backtrace", "Show stack backtrace",mon_stacktrace}
};
//......

int
for_stack(int argc,char **argv,struct Trapframe *tf)
{
    uint32_t *ebp=(uint32_t*)read_ebp();
    while(ebp!=NULL){
        struct Eipdebuginfo info;
        uint32_t eip = ebp[1];
        debuginfo_eip((int)eip, &info);
        cprintf("  ebp %8x  eip %8x  args %08x %08x %08x %08x %08x\n",
            ebp,ebp[1],ebp[2],ebp[3],ebp[4],ebp[5],ebp[6]);
        const  char* filename=(&info)->eip_file;
        int line = (&info)->eip_line;
        const char * not_null_ter_fname=(&info)->eip_fn_name;
        int offset = (int)(eip)-(int)((&info)->eip_fn_addr);
        cprintf("        %s:%d:  %.*s+%d\n",filename,line,info.eip_fn_namelen,not_null_ter_fname,offset);
        ebp=(uint32_t *)(*ebp);
    }
    return 0;
}
int
mon_stacktrace(int argc,char **argv,struct Trapframe *tf)
{
    cprintf("Stack backtrace:\n");
    return for_stack(argc,argv,tf);
}
其中关于文件行号的查找实现,对照上下文就能实现,注意 N_SLINE这就是之前说 stab时提到的一个有用的属性。
// Search within [lline, rline] for the line number stab.

// If found, set info->eip_line to the right line number.

// If not found, return -1.

//
// Hint:
//  There's a particular stabs type used for line numbers.

//  Look at the STABS documentation and  to find
//  which one.

// Your code here.

stab_binsearch(stabs, &lline, &rline, N_SLINE, addr);
if(llineeip_line=stabs[lline].n_desc;
}else{
    return -1;
}
运行结果如下:
之后运行评分程序
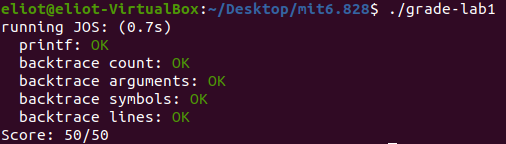
至此, Lab1完结。完整代码仓库可点击:https://github.com/Elio-yang/MIT6.828
Original: https://www.cnblogs.com/oasisyang/p/15365482.html
Author: OasisYang
Title: MIT6.828——Lab1 partB(麻省理工操作系统课程实验)
原创文章受到原创版权保护。转载请注明出处:https://www.johngo689.com/524485/
转载文章受原作者版权保护。转载请注明原作者出处!