

前言
聚类是一个无监督学习问题,该算法的思想是物以类聚,人以群分,聚类算法感知样本之间的相似性,对新输入的输出进行分类预测,输出变量取有限个数的离散值。这一次,我们使用了两种方法对虹膜数据进行聚类。
[En]
Clustering is a problem of unsupervised learning, the idea of the algorithm is that birds of a feather flock together, people are divided into groups, clustering algorithm perceives the similarity between samples, classifies, predicts the output of new inputs, and the output variables take a limited number of discrete values. This time, we use two methods to cluster the data of Iris.
- 无监督意味着分类没有标签
[En]
unsupervised means classifying without a label*
K-means 聚类算法
K-means聚类算法(k-均值或k-平均)聚类算法。算法思想就是首先随机确定k个中心点作为聚类中心,然后把每个数据点分配给最邻近的中心点,分配完成后形成k个聚类,计算各个聚类的平均中心点,将其作为该聚类新的类中心点,然后迭代上述步骤知道分配过程不在产生变化。
算法流程
- 随机选择K个随机点(成为聚类中心)
- 对数据集中的每个数据点,按照距离K个中心点的距离,将其与距离最近的中心点关联起来,与同一中心点关联的所有点聚成一类
- 计算每组均值,并将与该组关联的中心点移至平均位置
[En]
calculate the mean of each group and move the center point associated with the group to the average position*
- 重复前两步,直至中心点不再变化
[En]
repeat the previous two steps until the center point no longer changes*
优缺点
优点:
- 原则简单、实施容易、衔接快
[En]
simple in principle, easy to implement and fast in convergence*
- 聚类效果比较优
- 算法可解释度比较强
- 主要需要调参的参数仅仅是簇数K
缺点:
- K值选取不好把握
- 不平衡的数据聚类并不有效。
[En]
unbalanced data clustering is not effective.*
- 使用迭代方法,结果只是局部最优。
[En]
using iterative method, the result is only locally optimal.*
- 对噪音和异常点比较敏感
鸢尾花聚类
数据集
数据集:数据集采用sklern中的数据集
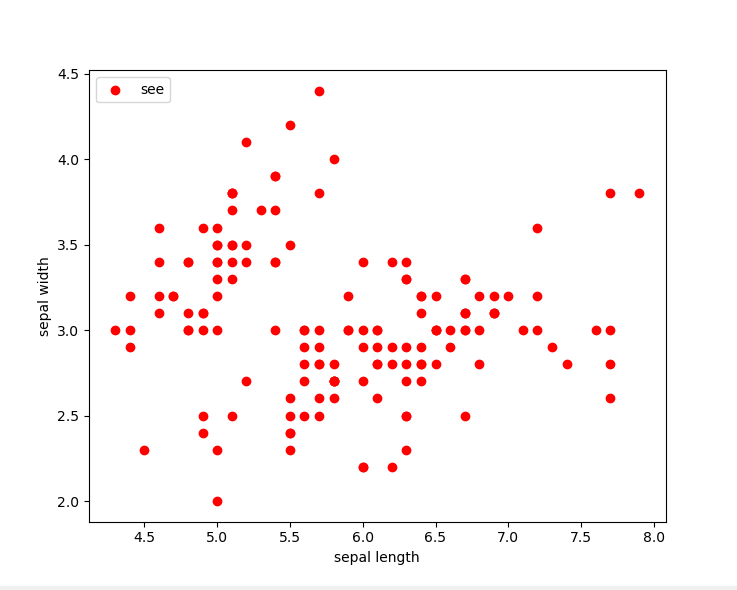
数据集分布图:我们可以看到数据的大致分布
[En]
Dataset distribution map: we can see the general distribution of the data

使用sklearn中的模型
鸢尾花数据集 150 条数据

## 导包
import numpy as np
import matplotlib.pyplot as plt

导入数据集包
from sklearn import datasets

from sklearn.cluster import KMeans

## 加载数据据集
iris = datasets.load_iris()

X = iris.data[:,:4]
print(X.shape)  # 150*4

## 绘制二维数据分布图
## 前两个特征

plt.scatter(X[:,0],X[:,1],c='red',marker='o',label='see')
plt.xlabel('sepal length')
plt.ylabel('sepal width')
plt.legend(loc=2)
plt.show()

'''
直接调用包
'''

## 实例化K-means类,并定义训练函数
def Model(n_clusters):
    estimator = KMeans(n_clusters=n_clusters)
    return estimator
## 定义训练韩硕
def train(estimator):
    estimator.fit(X)

## 训练
estimator = Model(3)

## 开启训练拟合
train(estimator=estimator)

## 可视化展示

label_pred = estimator.labels_ # 获取聚类标签

## 找到3中聚类结构
x0 = X[label_pred==0]
x1 = X[label_pred==1]
x2 = X[label_pred==2]

plt.scatter(x0[:,0],x0[:,1],c='red',marker='o',label='label0')
plt.scatter(x1[:,0],x1[:,1],c='green',marker='*',label='label1')
plt.scatter(x2[:,0],x2[:,1],c='blue',marker='+',label='label2')

plt.xlabel('sepal length')
plt.ylabel('sepal width')
plt.legend(loc=2)
plt.show()
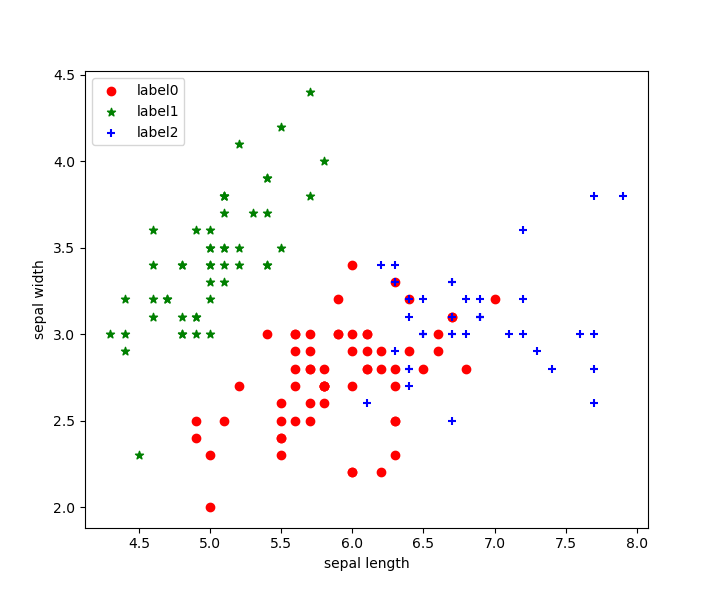
聚类结果
我们看到,根据我们的要求,聚类结果分为三类,分别以红、蓝、绿三种颜色展示!
[En]
We can see that the clustering results are divided into three categories according to our requirements, which are displayed in red, blue and green colors respectively!
聚类效果图:
手写K-means算法
鸢尾花数据集 150 条数据

## 导包
import numpy as np
import matplotlib.pyplot as plt

导入数据集包
from sklearn import datasets

from sklearn.cluster import KMeans

## 加载数据据集
iris = datasets.load_iris()

X = iris.data[:,:4]
print(X.shape)  # 150*4

## 绘制二维数据分布图
## 前两个特征

plt.scatter(X[:,0],X[:,1],c='red',marker='o',label='see')
plt.xlabel('sepal length')
plt.ylabel('sepal width')
plt.legend(loc=2)
plt.show()

'''
直接手写实现
'''

'''
1、随机初始化 随机寻找k个簇的中心
2、对这k个中心进行聚类
3、重复1、2,知道中心达到稳定
'''

### 欧氏距离计算
def distEclud(x,y):
    return np.sqrt(np.sum((x-y)**2))

### 为数据集定义簇的中心
def randCent(dataSet,k):
    m,n = dataSet.shape
    centroids = np.zeros((k,n))
    for i in range(k):
        index = int(np.random.uniform(0,m))
        centroids[i,:] = dataSet[index,:]

    return centroids

## k均值聚类算法
def KMeans(dataSet,k):
    m = np.shape(dataSet)[0]

    clusterAssment = np.mat(np.zeros((m,2)))
    clusterChange = True

    ## 1 初始化质心centroids
    centroids = randCent(dataSet,k)

    while clusterChange:
        # 样本所属簇不在更新时停止迭代
        clusterChange = False

        # 遍历所有样本
        for i in range(m):
            minDist = 100000.0
            minIndex = -1

            # 遍历所有质心
            # 2 找出最近质心
            for j in range(k):
                distance = distEclud(centroids[j,:],dataSet[i,:])
                if distance<mindist: mindist="distance" minindex="j" # 更新该行所属的簇 if clusterassment[i,0] !="minIndex:" clusterchange="True" clusterassment[i,:]="minIndex,minDist**2" 更新质心 for j in range(k): pointsincluster="dataSet[np.nonzero(clusterAssment[:,0].A" =="j)[0]]" 获取对应簇类所有的点 centroids[j,:]="np.mean(pointsInCluster,axis=0)" print("cluster complete") return centroids,clusterassment def draw(data, center, assment): length="len(center)" fig="plt.figure" data1="data[np.nonzero(assment[:,0].A" data2="data[np.nonzero(assment[:,0].A" data3="data[np.nonzero(assment[:,0].A" 选取前两个数据绘制原始数据的散点 plt.scatter(data1[:,0],data1[:,1],c="red" ,marker="o" ,label="label0" ) plt.scatter(data2[:,0],data2[:,1],c="green" plt.scatter(data3[:,0],data3[:,1],c="blue" 绘制簇的质心点 i range(length): plt.annotate('center',xy="(center[i,0],center[i,1]),xytext=(center[i,0]+1,center[i,1]+1),arrowprops=dict(facecolor='yellow'))" plt.show() 选取后两个维度绘制原始数据散点图 plt.scatter(data1[:, 2], data1[:, 3], c="red" , marker="o" label="label0" plt.scatter(data2[:, data2[:, plt.scatter(data3[:, data3[:, plt.annotate('center', xy="(center[i," center[i, 3]), xytext="(center[i," 2] + 1, 3] 1), arrowprops="dict(facecolor='yellow'))" ## 调用 dataset="X" k="3" draw(dataset,centroids,clusterassment) < code></mindist:>
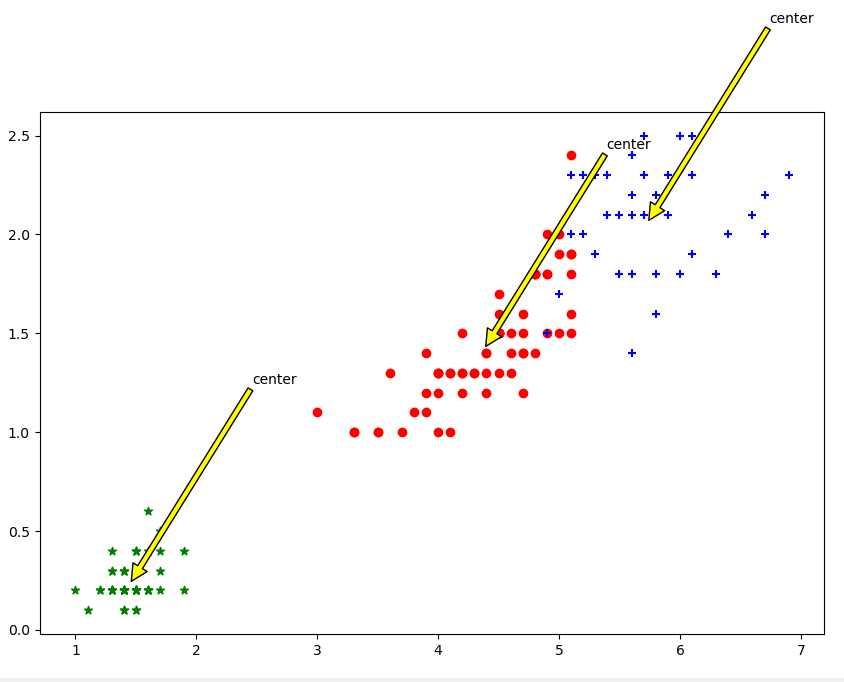
效果图展示
我们可以看到,手写实现也是以三种颜色实现的,我们可以看到两种实现的结果几乎是相同的。
[En]
We can see that the handwritten implementation is also implemented in three colors, and we can see that the results of the two implementations are almost the same.
- 根据花萼长度和花萼宽度进行聚类
[En]
clustering according to calyx length and calyx width*

- 根据花瓣长度和花瓣宽度进行分簇:
[En]
clustering according to petal length and petal width:*
总结
我们既可以使用sklearn包中封装好的模型进行聚类分析,也可以自己手写实现,在某些问题上,两者都可以达到相同的结果,我们对于不同的问题可以更合适的方法进行处理。
Original: https://www.cnblogs.com/hjk-airl/p/16410359.html
Author: hjk-airl
Title: 【机器学习】K-means聚类分析
原创文章受到原创版权保护。转载请注明出处:https://www.johngo689.com/499179/
转载文章受原作者版权保护。转载请注明原作者出处!